. 2014 Aug;34(16):2996-3012.
doi: 10.1128/MCB.01710-13. Epub 2014 Jun 9.

Transcriptional network analysis in muscle reveals AP-1 as a partner of PGC-1α in the regulation of the hypoxic gene program

Affiliations

Transcriptional network analysis in muscle reveals AP-1 as a partner of PGC-1α in the regulation of the hypoxic gene program

Mario Baresic et al. Mol Cell Biol. 2014 Aug.

Abstract

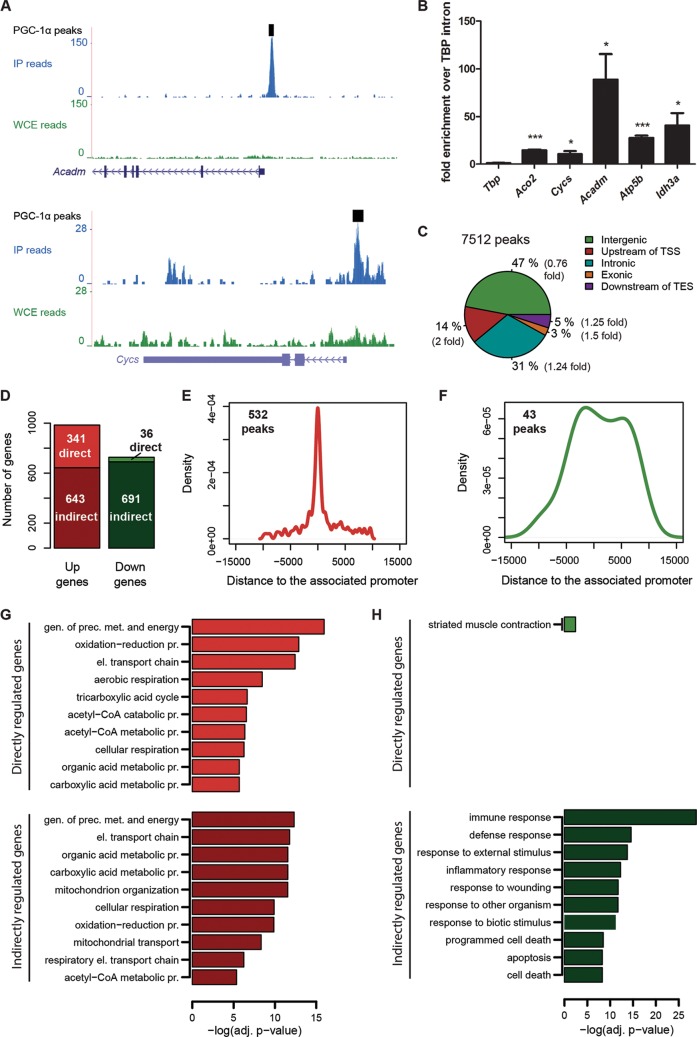
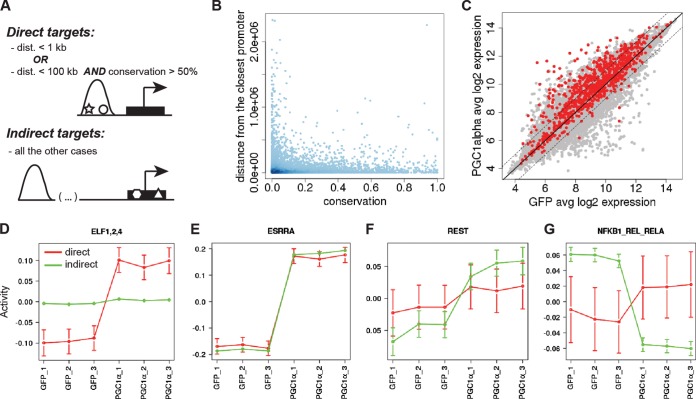
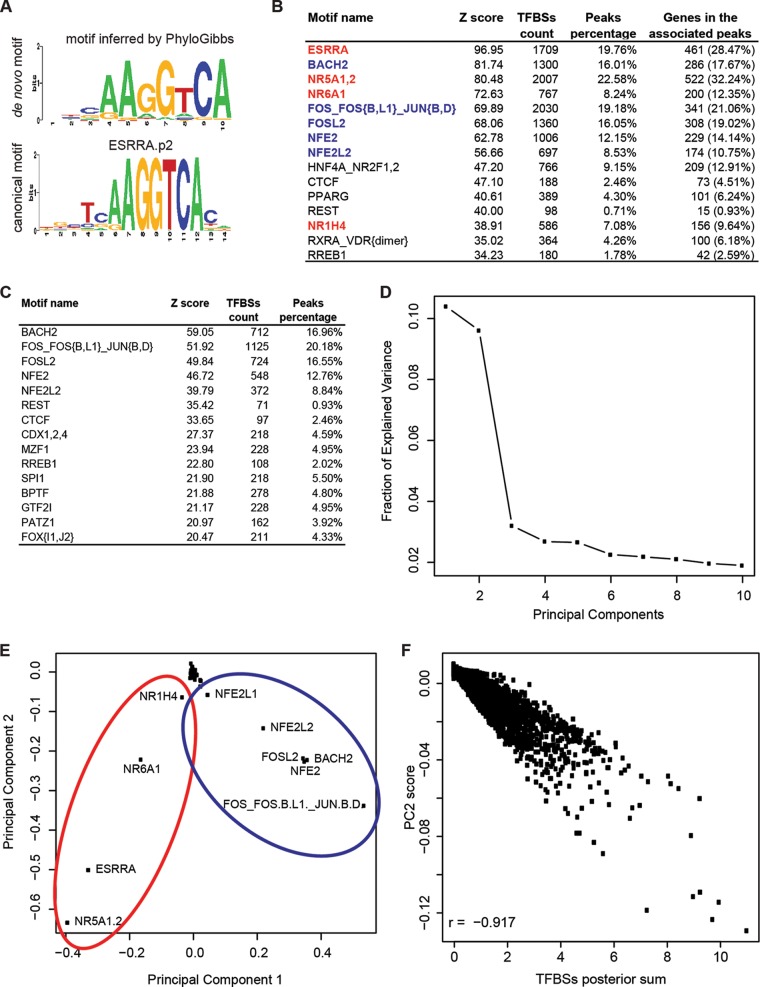
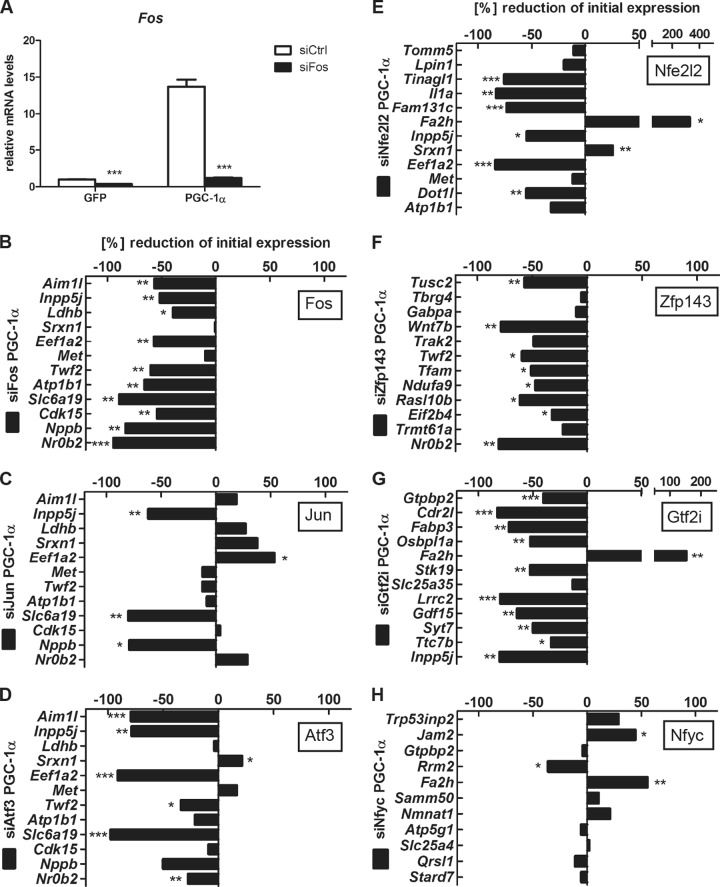
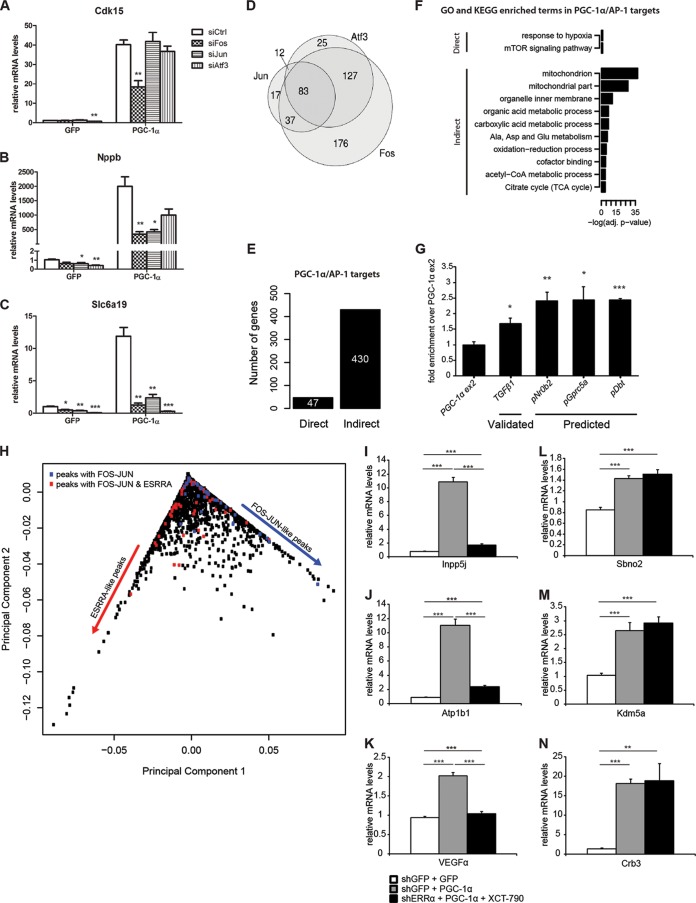
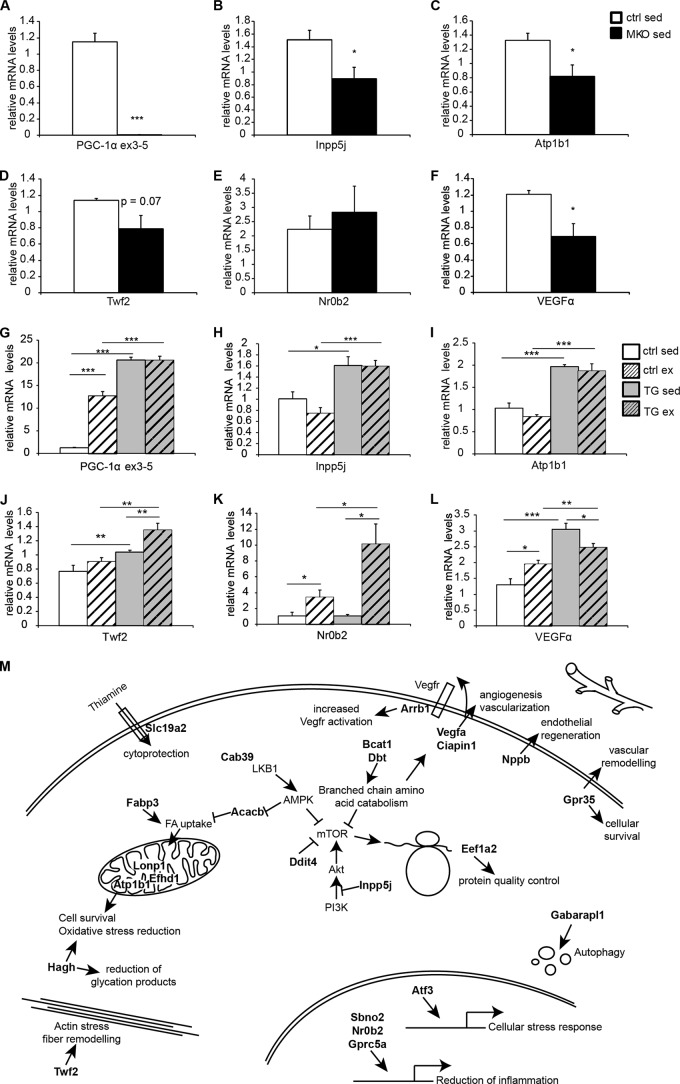
Skeletal muscle tissue shows an extraordinary cellular plasticity, but the underlying molecular mechanisms are still poorly understood. Here, we use a combination of experimental and computational approaches to unravel the complex transcriptional network of muscle cell plasticity centered on the peroxisome proliferator-activated receptor γ coactivator 1α (PGC-1α), a regulatory nexus in endurance training adaptation. By integrating data on genome-wide binding of PGC-1α and gene expression upon PGC-1α overexpression with comprehensive computational prediction of transcription factor binding sites (TFBSs), we uncover a hitherto-underestimated number of transcription factor partners involved in mediating PGC-1α action. In particular, principal component analysis of TFBSs at PGC-1α binding regions predicts that, besides the well-known role of the estrogen-related receptor α (ERRα), the activator protein 1 complex (AP-1) plays a major role in regulating the PGC-1α-controlled gene program of the hypoxia response. Our findings thus reveal the complex transcriptional network of muscle cell plasticity controlled by PGC-1α.


Figures

FIG 1
FIG 1
Genome-wide DNA recruitment of PGC-1α in mouse muscle cells. (A) PGC-1α ChIP-Seq binding peaks (read densities) around the TSSs of the genes Acadm and Cycs obtained from the UCSC Genome Browser. (B) Real-time PCR validation of the ChIP enrichment measured at the promoter of a set of PGC-1α target genes. Bars represent fold enrichment over that of the Tbp intron; error bars represent SEMs. *, P < 0.05; **, P < 0.01; ***, P < 0.001. (C) Mapping ChIP-Seq PGC-1α peaks across the genome. Transcription start site (TSS) and transcription end site (TES) are relative to mm9 RefSeq transcripts. “Intergenic,” ≥10 kb from the nearest transcript; “Upstream of TSS,” kb −10 to 0 relative to the TSS; “Downstream of TES,” kb 0 to +10 relative to the TES. Numbers in parentheses indicate, for each category, the ratio between the percentage of PGC-1α peaks and the percentage of the same number of randomly distributed peaks. (D) Histogram illustrating the number of direct and indirect genes either up- or downregulated by overexpression of PGC-1α in muscle cells. Direct genes are those associated with promoters found within ±10 kb relative to the nearest peak. (E) Distribution of the distances of 532 peaks from their associated upregulated gene promoters. (F) Distribution of the distances of 43 peaks from their associated downregulated gene promoters. (G and H) Subset of the top significantly enriched GO Biological Process terms identified for directly and indirectly upregulated (G) and downregulated (H) PGC-1α target genes.
FIG 2
FIG 2
Four distinct mechanistic modes of action for gene expression regulated by PGC-1α and TF partners. (A) Classification of direct and indirect target genes in MARA (see Materials and Methods). (B) Distribution of peak distance from the closest promoter and PhastCons conservation score of the peak. (C) Distribution of log2 expression values for all mouse promoters. Expression values were averaged across the 3 GFP and the 3 PGC-1α samples. Direct targets are depicted in red; indirect targets are depicted in gray. (D to G) Activity plot of the motifs ELF1,2,4 (D), ESRRA (E), REST (F), and NFKB1_REL_RELA (G) as predicted by MARA (motif activity response analysis). Red, direct targets; green, indirect targets.
FIG 3
FIG 3
PCA reveals FOS-JUN-like leucine zippers as a new class of putative functional PGC-1α partners. (A) Sequence logo of the top position weight matrix discovered de novo by PhyloGibbs in the top 200 scoring peaks and of the corresponding canonical motif of ERRα as predicted by STAMP. (B) Top-scoring results of motif search performed on all 7,512 PGC-1α peaks with MotEvo. Motifs depicted in red and blue correspond to the clusters identified by PCA in panel D. (C) Top-scoring results of motif search performed on the 3,656 “non-ESRRA-like” peaks with MotEvo. (D) Fraction of explained variance of the top 10 PCA components. (E) PCA of the 7,512 PGC-1α peaks. Eigenmotif scores across principal component 1 (PC1) and principal component 2 (PC2) are shown. Red and blue ellipses highlight motif clusters, as identified by PC1, of nuclear hormone receptor-like zinc finger and FOS-JUN-like leucine zipper proteins, respectively. (F) Correlation between principal component 2 scores and binding site posterior sum for each peak relative to the top 10 PCA motifs. “r” refers to the Pearson correlation coefficient.
FIG 4
FIG 4
Validation of TFs associated with top-scoring motifs reveals novel functional PGC-1α partners. (A) siRNA-mediated knockdown efficiency for FOS. Bars represent fold induction over GFP/siCtrl value; error bars represent SEMs. *, P < 0.05; **, P < 0.01; ***, P < 0.001. See also Fig. S3 in the supplemental material. (B to H) Quantitative real-time PCR analysis of PGC-1α target genes whose associated peak contains at least one binding site for the motif FOS_FOS(B,L1)_JUN(B,D) (B to D), NFE2L2 (E), ZNF143, also known as ZFP143 (F), GTF2I (G), or NFY(A,B,C) (H). Bars represent % change compared to PGC-1α/siCtrl values. Error bars represent SEMs. *, P < 0.05; **, P < 0.01; ***, P < 0.001.
FIG 5
FIG 5
PGC-1α controls the hypoxia gene program via a functional interaction with different configurations of the AP-1 protein complex. (A to C) Quantitative real-time PCR analysis of Cdk15 (A), Nppb (B), and Slc6a19 (C) mRNA levels in response to PGC-1α overexpression and either siFos, siJun, or siAtf3 knockdown. Data are normalized to mRNA levels in GFP adenovirus-infected cells. Error bars represent ±SEMs. *, P < 0.05; **, P < 0.01; ***, P < 0.001. (D) Venn diagram illustrating the overlap in number of genes upregulated by PGC-1α and downregulated by either FOS, JUN, or ATF3 knockdown. (E) Histogram illustrating the number of direct and indirect PGC-1α/AP-1 target genes. (F) Subset of the top significantly enriched Gene Ontology and KEGG terms identified for the two gene groups illustrated in panel E. TCA, tricarboxylic acid. (G) Quantitative real-time PCR validation of the ChIP enrichment of c-Fos measured at the gene TGFβ1 (validated) and at the promoters of Nr0b2, Gprc5a, and Dbt (predicted) target genes. Bars represent fold enrichment over PGC-1α exon 2 set as 1. Error bars represent SEMs. *, P < 0.05; **, P < 0.01; ***, P < 0.001. (H) PCA of the 7,512 PGC-1α peaks. Eigenpeak scores across principal component 1 and principal component 2 are shown. Colored dots correspond to peaks associated to the 47 direct PGC-1α/AP-1 targets. Blue dots refer to genes associated with peaks containing only FOS-JUN TFBSs, while red dots refer to genes associated with peaks with FOS-JUN and ESRRA TFBSs, located either in the same peak or in distinct PGC-1α peaks. (I to K) Quantitative real-time PCR analysis of PGC-1α/AP-1 targets whose associated peaks contain an ESRRA binding site. The bars represent relative mRNA levels compared to AV-shGFP plus AV-GFP plus vehicle, which is set as 1. The error bars represent SEMs. *, P < 0.05; **, P < 0.01; ***, P < 0.001. (L to N) Quantitative real-time PCR analysis of PGC-1α/AP-1 targets whose associated peaks (if any) do not contain an ESRRA binding site. The bars represent relative mRNA levels compared to AV-shGFP plus AV-GFP plus vehicle, which is set as 1. The error bars represent SEMs. *, P < 0.05; **, P < 0.01; ***, P < 0.001.
FIG 6
FIG 6
PGC-1α controls the hypoxic gene program in muscle in vivo. (A to F) Quantitative real-time PCR analysis of hypoxic genes in sedentary control (ctrl) and muscle-specific knockout (MKO) mice. The control group is set as 1. Error bars represent SEMs. *, P < 0.05; **, P < 0.01; ***, P < 0.001. (G to L) Quantitative real-time PCR analysis of hypoxic genes in treadmill-running mice. Control (ctrl) and muscle-specific transgenic (TG) mice were used under sedentary and exercise conditions. The control group under sedentary conditions is set as 1. Error bars represent SEMs. *, P < 0.05; **, P < 0.01; ***, P < 0.001. (M) Schematic representation depicting the downstream effects of the functional interaction between PGC-1α and the AP-1 complex in the context of the hypoxia gene program. Direct targets of PGC-1α and AP-1 are indicated in bold.

References

    1. Handschin C, Spiegelman BM. 2008. The role of exercise and PGC1alpha in inflammation and chronic disease. Nature 454:463–469. 10.1038/nature07206 - DOI - PMC - PubMed
    1. Pedersen BK, Febbraio MA. 2012. Muscles, exercise and obesity: skeletal muscle as a secretory organ. Nat. Rev. Endocrinol. 8:457–465. 10.1038/nrendo.2012.49 - DOI - PubMed
    1. Handschin C. 2010. Regulation of skeletal muscle cell plasticity by the peroxisome proliferator-activated receptor gamma coactivator 1alpha. J. Recept. Signal Transduct. Res. 30:376–384. 10.3109/10799891003641074 - DOI - PubMed
    1. Handschin C, Spiegelman BM. 2006. Peroxisome proliferator-activated receptor gamma coactivator 1 coactivators, energy homeostasis, and metabolism. Endocr. Rev. 27:728–735. 10.1210/er.2006-0037 - DOI - PubMed
    1. Finck BN, Kelly DP. 2006. PGC-1 coactivators: inducible regulators of energy metabolism in health and disease. J. Clin. Invest. 116:615–622. 10.1172/JCI27794 - DOI - PMC - PubMed

Publication types

MeSH terms

Substances

Associated data