. 2014 Sep;16(5):1018-28.
doi: 10.1208/s12248-014-9626-3. Epub 2014 Jun 11.

Application of a physiologically based pharmacokinetic model informed by a top-down approach for the prediction of pharmacokinetics in chronic kidney disease patients

Affiliations

Application of a physiologically based pharmacokinetic model informed by a top-down approach for the prediction of pharmacokinetics in chronic kidney disease patients

Hiroyuki Sayama et al. AAPS J. 2014 Sep.

Abstract

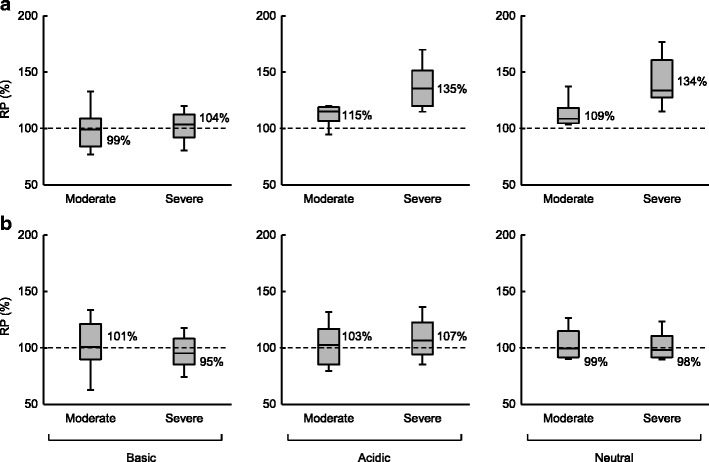
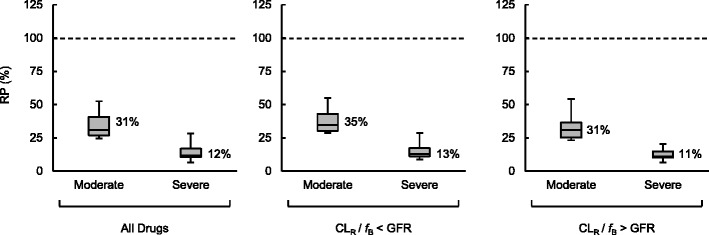
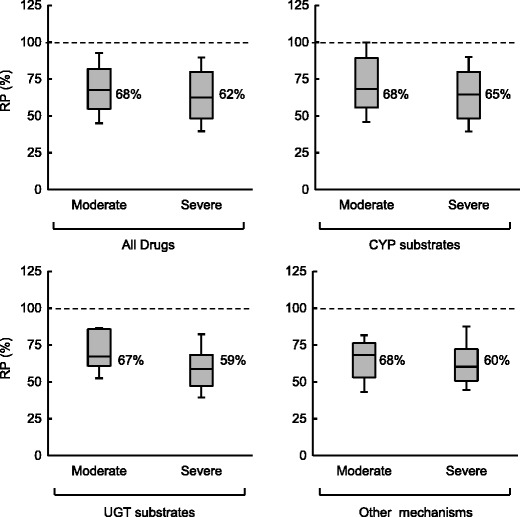
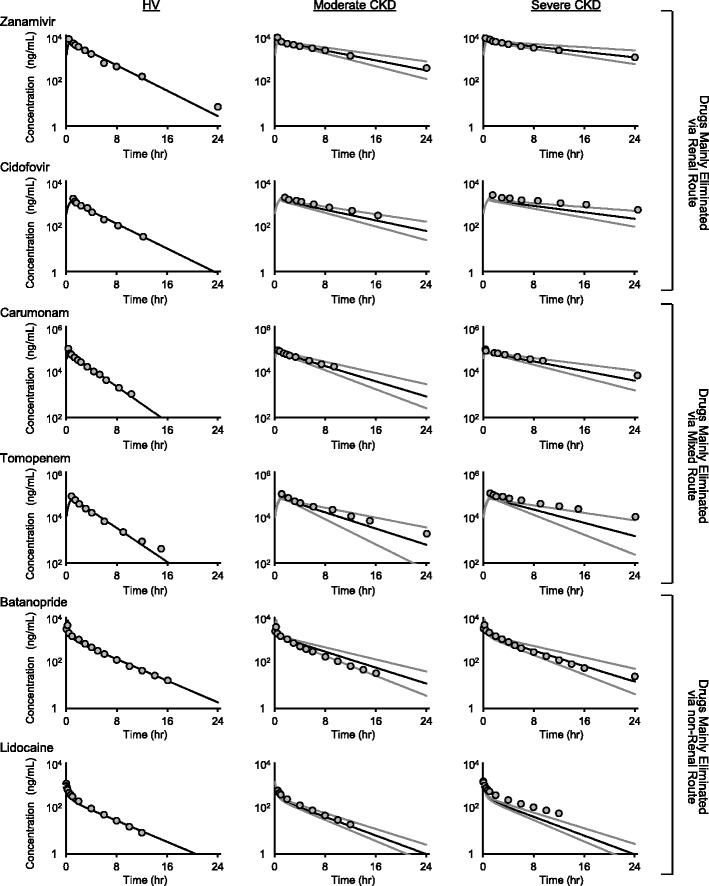
Quantitative prediction of the impact of chronic kidney disease (CKD) on drug disposition has become important for the optimal design of clinical studies in patients. In this study, clinical data of 151 compounds under CKD conditions were extensively surveyed, and alterations in pharmacokinetic parameters were evaluated. In CKD patients, the unbound hepatic intrinsic clearance decreased to a similar extent for drugs eliminated via hepatic metabolism by cytochrome P450, UDP-glucuronosyltransferase, and other mechanisms. Renal clearance showed a similar decrease to glomerular filtration rate, irrespective of the contribution of tubular secretion. The scaling factor (SF) obtained from the interquartile range of the relative change in each parameter was applied to the well-stirred model to predict clearance in patients. Hepatic and renal clearance could be successfully predicted for approximately half and two-thirds, respectively, of the applied compounds, showing the high utility of SFs. SFs were also introduced to a physiologically based pharmacokinetic (PBPK) model, and the plasma concentration profiles of 12 model compounds with different elimination pathways were predicted for CKD patients. The PBPK model combined with SFs provided good predictability for plasma concentration. The developed PBPK model with information on SFs would accelerate translational research in drug development by predicting pharmacokinetics in CKD patients.


Figures

Fig. 1
Fig. 1
RP of f p (a) and V ss (b) in moderate and severe CKD. In the boxes, the middle lines represent the median values, the top and bottom margins represent the 75th and 25th percentiles, and the top and bottom whiskers represent the 90th and 10th percentiles. The percentages on the right of the boxes represent median values
Fig. 2
Fig. 2
RP of CLR in moderate and severe CKD. In the boxes, the middle lines represent the median values, the top and bottom margins represent the 75th and 25th percentiles, and the top and bottom whiskers represent the 90th and 10th percentiles. The percentages on the right of the boxes represent median values
Fig. 3
Fig. 3
RP of CLUintH in moderate and severe CKD obtained from the 1st dataset. In the boxes, the middle lines represent the median values, the top and bottom margins represent the 75th and 25th percentiles, and the top and bottom whiskers represent the 90th and 10th percentiles. The percentages on the right of the boxes represent median values
Fig. 4
Fig. 4
Examples of plasma concentration-time simulations after intravenous dosing in HV and CKD conditions by the PBPK model combined with SFs. The black lines represent averaged predicted curves. The gray lines represent the predicted ranges of plasma concentrations. The gray circles are observed concentrations of each model compound. Best (zanamivir, carumonam, batanopride) and worst (cidofovir, tomopenem, lidocaine) cases of prediction in each group of drugs mainly eliminated via renal route, mixed route and non-renal route are presented

References

    1. Coresh J, Selvin E, Stevens LA, Manzi J, Kusek JW, Eggers P, et al. Prevalence of chronic kidney disease in the United States. JAMA. 2007;298:2038–47. doi: 10.1001/jama.298.17.2038. - DOI - PubMed
    1. 2013 USRDS annual data report. Available from: www.usrds.org/adr.aspx.
    1. Dreisbach AW. The influence of chronic renal failure on drug metabolism and transport. Clin Pharmacol Ther. 2009;86:553–6. doi: 10.1038/clpt.2009.163. - DOI - PubMed
    1. Nolin TD, Naud J, Leblond FA, Pichette V. Emerging evidence of the impact of kidney disease on drug metabolism and transport. Clin Pharmacol Ther. 2008;83:898–903. doi: 10.1038/clpt.2008.59. - DOI - PubMed
    1. Sun H, Frassetto L, Benet LZ. Effects of renal failure on drug transport and metabolism. Pharmacol Ther. 2006;109:1–11. doi: 10.1016/j.pharmthera.2005.05.010. - DOI - PubMed

MeSH terms

Substances