

Rapid measurement of macronutrients in breast milk: How reliable are infrared milk analyzers?
- PMID: 24912866
- PMCID: PMC5050037
- DOI: 10.1016/j.clnu.2014.05.005
Rapid measurement of macronutrients in breast milk: How reliable are infrared milk analyzers?
Abstract
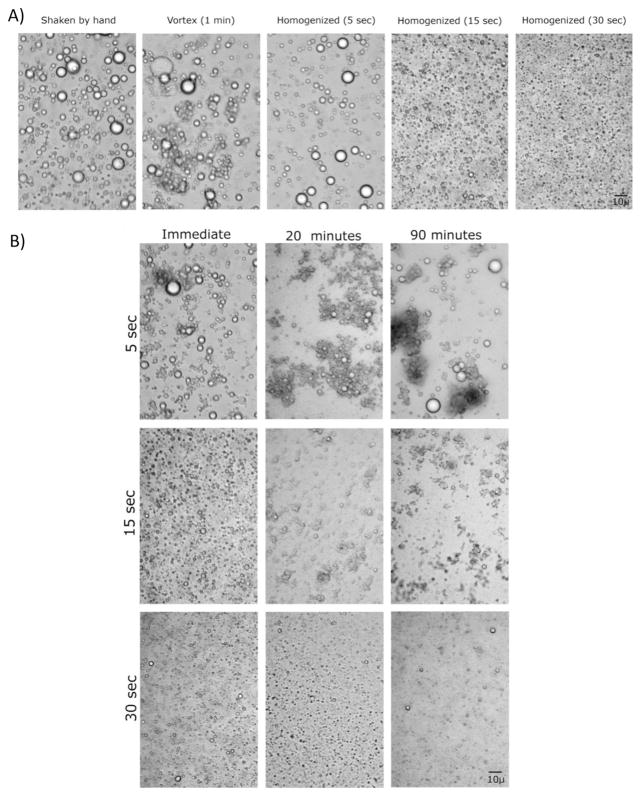
Background & aims: Significant biological variation in macronutrient content of breast milk is an important barrier that needs to be overcome to meet nutritional needs of preterm infants. To analyze macronutrient content, commercial infrared milk analyzers have been proposed as efficient and practical tools in terms of efficiency and practicality. Since milk analyzers were originally developed for the dairy industry, they must be validated using a significant number of human milk samples that represent the broad range of variation in macronutrient content in preterm and term milk. Aim of this study was to validate two milk analyzers for breast milk analysis with reference methods and to determine an effective sample pretreatment. Current evidence for the influence of (i) aliquoting, (ii) storage time and (iii) temperature, and (iv) vessel wall adsorption on stability and availability of macronutrients in frozen breast milk is reviewed.
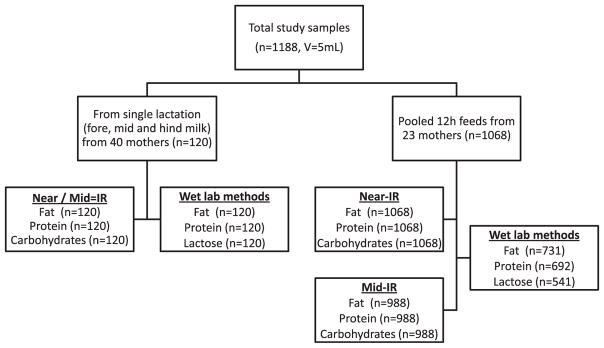
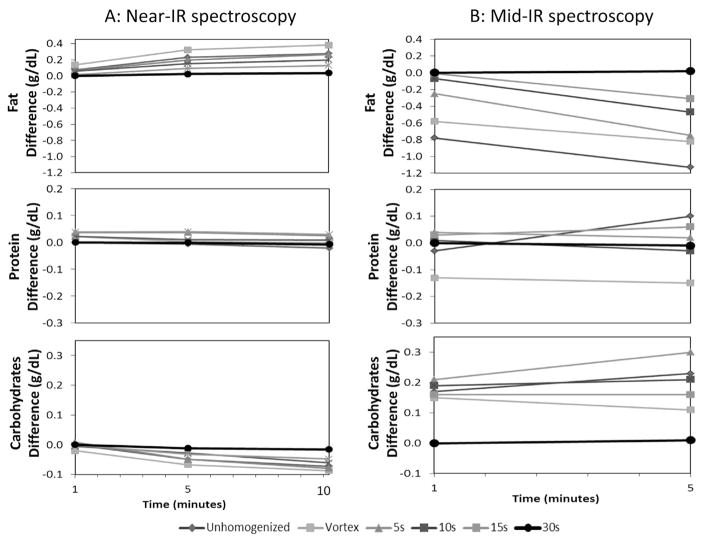
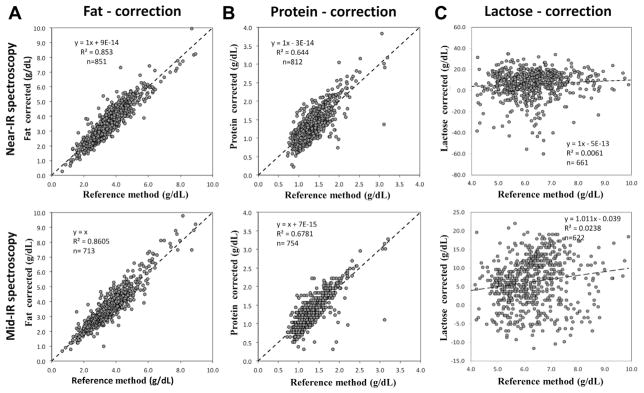
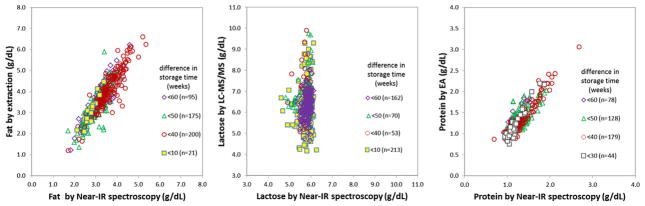
Methods: Breast milk samples (n = 1188) were collected from 63 mothers of preterm and term infants. Milk analyzers: (A) Near-infrared milk analyzer (Unity SpectraStar, USA) and (B) Mid-infrared milk analyzer (Miris, Sweden) were compared to reference methods, e.g. ether extraction, elemental analysis, and UPLC-MS/MS for fat, protein, and lactose, respectively.
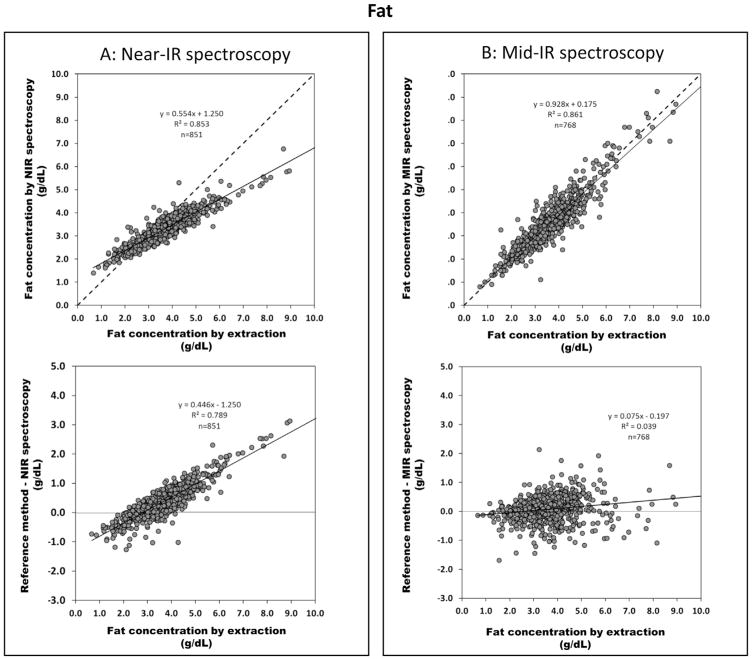
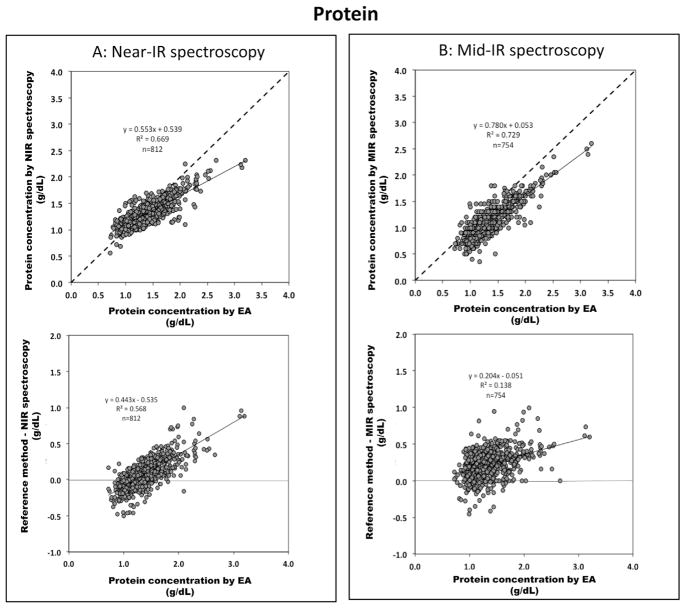
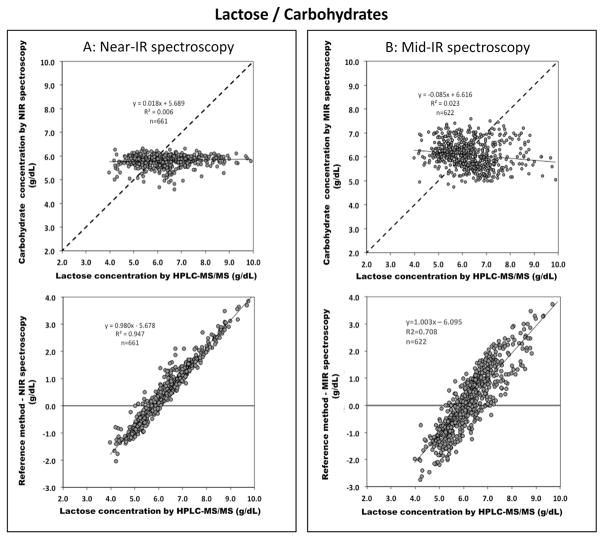
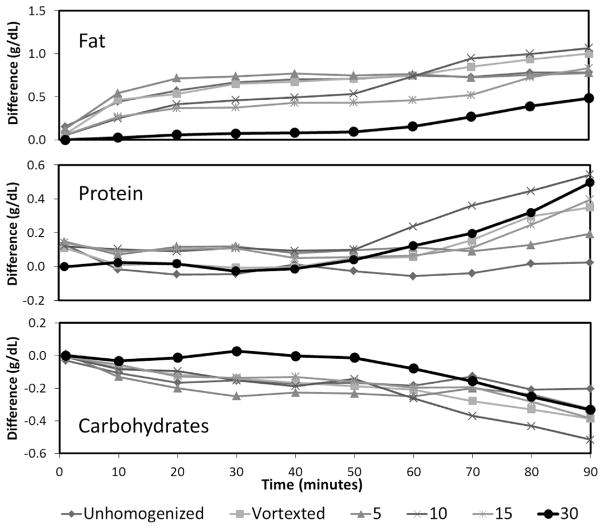
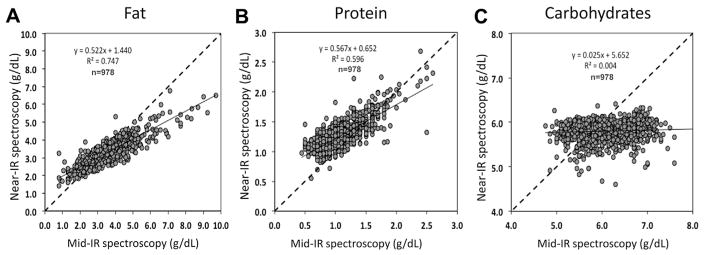
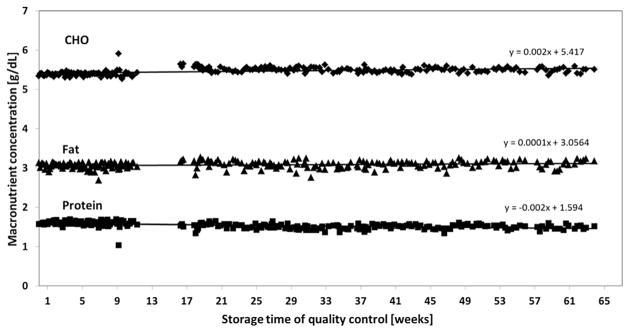
Results: For fat analysis, (A) measured precisely but not accurately (y = 0.55x + 1.25, r(2) = 0.85), whereas (B) measured precisely and accurately (y = 0.93x + 0.18, r(2) = 0.86). For protein analysis, (A) was precise but not accurate (y = 0.55x + 0.54, r(2) = 0.67) while (B) was both precise and accurate (y = 0.78x + 0.05, r(2) = 0.73). For lactose analysis, both devices (A) and (B) showed two distinct concentration levels and measured therefore neither accurately nor precisely (y = 0.02x + 5.69, r(2) = 0.01 and y = -0.09x + 6.62, r(2) = 0.02 respectively). Macronutrient levels were unchanged in two independent samples of stored breast milk (-20 °C measured with IR; -80 °C measured with wet chemistry) over a period of 14 months.
Conclusions: Milk analyzers in the current configuration have the potential to be introduced in clinical routine to measure fat and protein content, but will need major adjustments.
Keywords: Fat; Freeze thaw cycle; Lactose; Protein; Stability; Validation study.
Copyright © 2014 The Authors. Published by Elsevier Ltd.. All rights reserved.
Conflict of interest statement
The authors have no potential conflicts of interest.
Figures
References
-
- Lucas A, Cole TJ. Breast milk and neonatal necrotising enterocolitis. Lancet. 1990;336:1519–23. - PubMed
-
- Maggio L, Costa S, Gallini F. Human milk fortifiers in very low birth weight infants. Early Hum Dev. 2009;85:S59–61. - PubMed
-
- Lemons JA, Moye L, Hall D, Simmons M. Differences in the composition of preterm and term human milk during early lactation. Pediatr Res. 1982;16:113–7. - PubMed
-
- Polberger S. New approaches to optimizing early diets. Nestle Nutr Workshop Ser Pediatr Program. 2009;63:195–208. - PubMed
-
- Lonnerdal B. Personalizing nutrient intakes of formula-fed infants: breast milk as a model. Nestle Nutr Workshop Ser Pediatr Program. 2008;62:189–203. - PubMed
Publication types
MeSH terms
Substances
Grants and funding
LinkOut - more resources
Full Text Sources
Other Literature Sources
Medical
