. 2014 Oct;140(10):1689-704.
doi: 10.1007/s00432-014-1727-y. Epub 2014 Jun 10.

A cisplatin-resistant head and neck cancer cell line with cytoplasmic p53(mut) exhibits ATP-binding cassette transporter upregulation and high glutathione levels

Affiliations

A cisplatin-resistant head and neck cancer cell line with cytoplasmic p53(mut) exhibits ATP-binding cassette transporter upregulation and high glutathione levels

Manuel Tonigold et al. J Cancer Res Clin Oncol. 2014 Oct.

Abstract

Purpose: Head and neck squamous cell carcinoma (HNSCC) cell lines with cytoplasmically sequestered mutant p53 (p53(mut_c)) are frequently more resistant to cisplatin (CDDP) than cells with mutant but nuclear p53 (p53(mut_n)). The aim of the study was to identify underlying mechanisms implicated in CDDP resistance of HNSCC cells carrying cytoplasmic p53(mut).

Methods: Microarray analysis, quantitative reverse transcription polymerase chain reaction, Western blot analysis and immunocytochemistry were used to identify and evaluate candidate genes involved in CDDP resistance of p53(mut_c) cells. RNAi knockdown or treatment with inhibitors together with flow cytometry-based methods was used for functional assessment of the identified candidate genes. Cellular metabolic activity was assessed with the XTT assay, and the redox capacity of cells was evaluated by measuring cellular glutathione (GSH) levels.

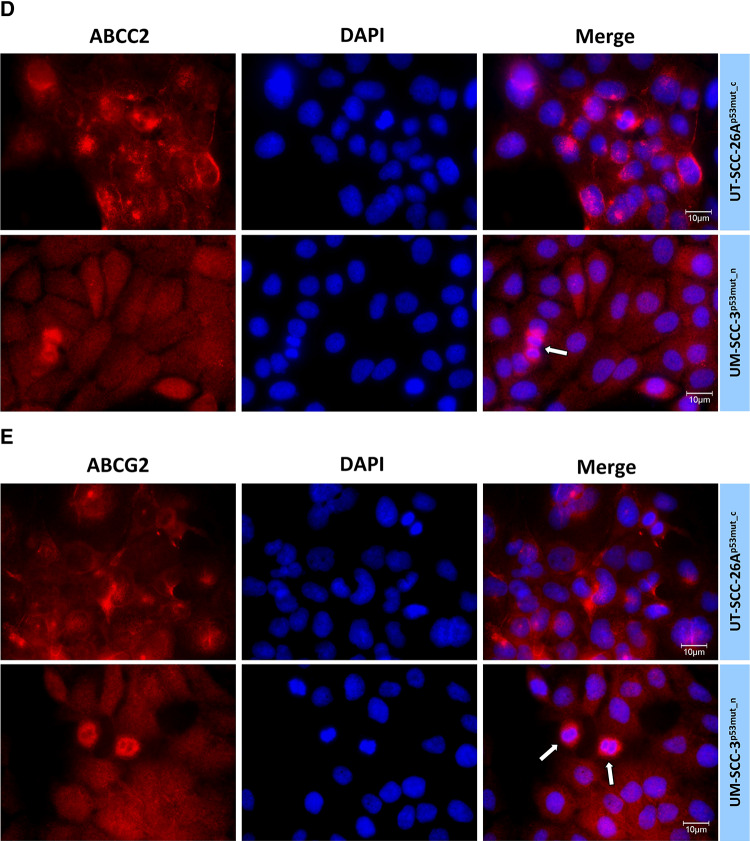
Results: Upregulation of ABCC2 and ABCG2 transporters was observed in CDDP-resistant p53(mut_c) HNSCC cells. Furthermore, p53(mut_c) cells exhibited a pronounced side population that could be suppressed by RNAi knockdown of ABCG2 as well as treatment with the ATP-binding-cassette transporter inhibitors imatinib, MK571 and tariquidar. Metabolic activity and cellular GSH levels were higher in CDDP-resistant p53(mut_c) cells, consistent with a higher capacity to fend off cytotoxic oxidative effects such as those caused by CDDP treatment. Finally, ABCC2/G2 inhibition of HNSCC cells with MK571 markedly enhanced CDDP sensitivity of HNSCC cells.

Conclusions: The observations in this study point to a major role of p53(mut_c) in conferring a stem cell like phenotype to HNSCC cells that is associated with ABCC2/G2 overexpression, high GSH and metabolic activity levels as well as CDDP resistance.


Conflict of interest statement

All authors have no conflict of interest.

Figures

Fig. 1
Fig. 1
The ABC transporters ABCC2 (MRP2) and ABCG2 (BCRP1) are overexpressed in CDDP-resistant p53mut_c HNSCC cells. a Microarray analysis, comparing the expression levels of 49 ABC transporters between the CDDP-resistant HNSCC cell line UT-SCC-26Ap53mut_c carrying a cytoplasmic p53 mutant protein (p53mut_c) and the CDDP-sensitive HNSCC cell line UM-SCC-3p53mut_n expressing a p53 protein that can localize to the nucleus (p53mut_n) (Mandic et al. 2005) reveal a marked upregulation of ABCC transporter subfamily members, in particular ABCC2 and the ABCG subfamily member ABCG2. b Expression levels of these two dominant ABC transporters (highlighted red in a) were validated by quantitative RT-PCR confirming a significant upregulation of ABCC2 and ABCG2 mRNA in UT-SCC-26Ap53mut_c cells compared with UM-SCC-3p53mut_n, which also was seen on the protein level in c. (d and e) Immunocytochemistry was performed to visualize both ABC transporters at the subcellular level. Both transporters exhibit high expression levels in a large number of UT-SCC-26Ap53mut_c cells (d and e, upper panel), whereas most of UM-SCC-3p53mut_n cells demonstrate low ABCC2 and ABCG2 (d and e, lower panel) levels except for cells that have entered mitosis (white arrows). Size bar is depicted in the merged images. DAPI was used to visualize cell nuclei. *p < 0.05, **p < 0.01, ***p < 0.001
Fig. 1
Fig. 1
The ABC transporters ABCC2 (MRP2) and ABCG2 (BCRP1) are overexpressed in CDDP-resistant p53mut_c HNSCC cells. a Microarray analysis, comparing the expression levels of 49 ABC transporters between the CDDP-resistant HNSCC cell line UT-SCC-26Ap53mut_c carrying a cytoplasmic p53 mutant protein (p53mut_c) and the CDDP-sensitive HNSCC cell line UM-SCC-3p53mut_n expressing a p53 protein that can localize to the nucleus (p53mut_n) (Mandic et al. 2005) reveal a marked upregulation of ABCC transporter subfamily members, in particular ABCC2 and the ABCG subfamily member ABCG2. b Expression levels of these two dominant ABC transporters (highlighted red in a) were validated by quantitative RT-PCR confirming a significant upregulation of ABCC2 and ABCG2 mRNA in UT-SCC-26Ap53mut_c cells compared with UM-SCC-3p53mut_n, which also was seen on the protein level in c. (d and e) Immunocytochemistry was performed to visualize both ABC transporters at the subcellular level. Both transporters exhibit high expression levels in a large number of UT-SCC-26Ap53mut_c cells (d and e, upper panel), whereas most of UM-SCC-3p53mut_n cells demonstrate low ABCC2 and ABCG2 (d and e, lower panel) levels except for cells that have entered mitosis (white arrows). Size bar is depicted in the merged images. DAPI was used to visualize cell nuclei. *p < 0.05, **p < 0.01, ***p < 0.001
Fig. 2
Fig. 2
The UT-SCC-26Ap53mut_c cell line exhibits a prominent SP phenotype. a The UT-SCC-26A cell line has a more prominent Hoechst 33342—low SP phenotype than UM-SCC-3p53mut_n. b The SP phenotype in both cell lines can be efficiently suppressed by the ABC transporter inhibitors imatinib, MK571 and tariquidar in a dose-dependent manner. *p < 0.05, **p < 0.01, ***p < 0.001, a total of 10 × 103 events were recorded for each measurement in a
Fig. 3
Fig. 3
p53mut_c cells exhibit higher metabolic activity and glutathione levels than p53mut_n cells. a The metabolic activity (formazan dye absorption) was evaluated with the XTT assay in the absence or presence of tariquidar (TQD) or MK571. p53mut_c cells exhibit higher metabolic activity levels than p53mut_n cells, which was independent of the presence of ABC transporter inhibitors. In p53mut_n cells, there was no effect on metabolic activity after inhibitor treatment, whereas p53mut_c cells exhibited a moderate but significant drop in activity levels after TQD or MK571 treatment. b Depicted are the total cellular glutathione levels as well as the glutathione levels derived from reduced (GSH) and oxidized (GSSG) glutathione (upper graph). Total glutathione, GSH and GSSG levels were significantly higher in p53mut_c compared with p53mut_n cells. No significant differences were observed after inhibitor treatment compared with the respective vehicle control except for GSSG levels that were higher after tariquidar treatment in UM-SCC-3p53mut_n cells and lower after MK571-treatment in UT-SCC-26Ap53mut_c cells. (lower graph) The ratio of reduced and oxidized glutathione (GSH/GSSG) did not show significant differences between the two cell lines. *p < 0.05, **p < 0.01, ***p < 0.001, n.s. not significant
Fig. 4
Fig. 4
RNAi knockdown of ABCG2 and ABCC2 in p53mut_c HNSCC cells. Reduction of ABCG2 levels (siABCG2) could efficiently (31 %) reduce Hoechst 33342 SP formation, whereas knockdown of ABCC2 (siABCC2) only marginally (88 %) reduced SP levels compared to non-target RNA (NT)—treated control cells. Simultaneous knockdown of ABCC2 and ABCG2 (siABCC2+siABCG2) could not reduce SP formation (33 %) more than ABCG2 knockdown alone despite efficient ABCC2 knockdown as confirmed by quantitative RT-PCR (a total of 50 × 103 events were recorded for each measurement). *p < 0.05, **p < 0.01, ***p < 0.001. (WB Western blot)
Fig. 5
Fig. 5
Treatment with MK571 sensitizes HNSCC cells to cisplatin. Cells were either treated or not treated with MK571 and exposed to 3.125, 6.25, 12.5 or 25 µM CDDP. Cell death (% dead cells) was quantified by flow cytometry after PI staining. (Western blot analysis, see supplementary Figure 1)
Fig. 6
Fig. 6
Proposed model highlighting the possible interrelation between the nucleocytoplasmic distribution of mutant p53, CSC phenotype, ABC transporter expression, GSH levels, metabolism and cisplatin sensitivity in HNSCC cells. HNSCC cells harboring TP53 mutations resulting in cytoplasmic sequestration of the protein (p53mut_c) are distinct from HNSCC cells carrying other TP53 mutations such as those affecting the DNA binding domain but still allow the protein to enter the nucleus (p53mut_n). HNSCC cells with p53mut_c more likely acquire a CSC phenotype that is associated with ABC transporter upregulation, high GSH and metabolism levels and cisplatin resistance than cells with p53mut_n

References

    1. Akiyama M (2010) ABCA12 mutations and autosomal recessive congenital ichthyosis: a review of genotype/phenotype correlations and of pathogenetic concepts. Hum Mutat 31:1090–1096 - PubMed
    1. Alqawi O, Bates S, Georges E (2004) Arginine482 to threonine mutation in the breast cancer resistance protein ABCG2 inhibits rhodamine 123 transport while increasing binding. Biochem J 382:711–716 - PMC - PubMed
    1. Bahr O, Wick W, Weller M (2001) Modulation of MDR/MRP by wild-type and mutant p53. J Clin Invest 107:643–645 - PMC - PubMed
    1. Bleau AM, Hambardzumyan D, Ozawa T, Fomchenko EI, Huse JT, Brennan CW, Holland EC (2009) PTEN/PI3 K/Akt pathway regulates the side population phenotype and ABCG2 activity in glioma tumor stem-like cells. Cell Stem Cell 4:226–235 - PMC - PubMed
    1. Brendel C, Scharenberg C, Dohse M, Robey RW, Bates SE, Shukla S, Ambudkar SV, Wang Y, Wennemuth G, Burchert A, Boudriot U, Neubauer A (2007) Imatinib mesylate and nilotinib (AMN107) exhibit high-affinity interaction with ABCG2 on primitive hematopoietic stem cells. Leukemia 21:1267–1275 - PubMed

Publication types

MeSH terms

Substances

LinkOut - more resources