

Microcrystallization techniques for serial femtosecond crystallography using photosystem II from Thermosynechococcus elongatus as a model system
- PMID: 24914149
- PMCID: PMC4052858
- DOI: 10.1098/rstb.2013.0316
Microcrystallization techniques for serial femtosecond crystallography using photosystem II from Thermosynechococcus elongatus as a model system
Abstract
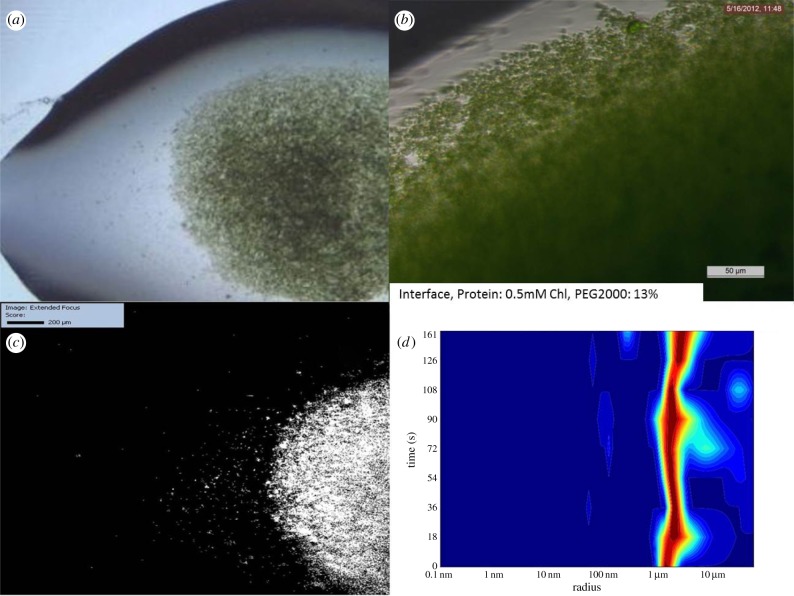
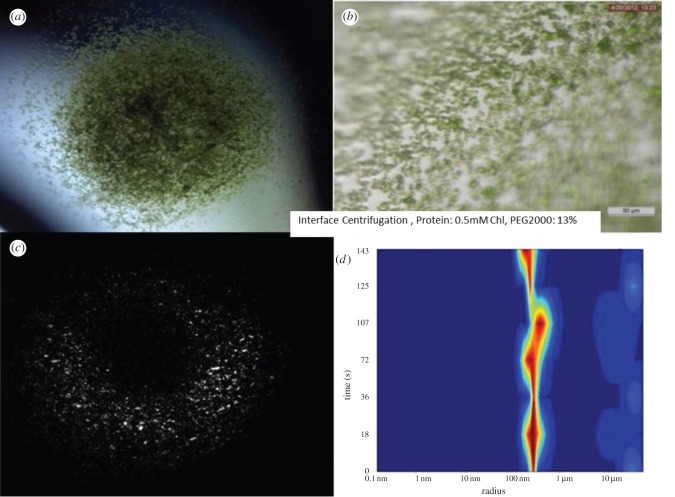
Serial femtosecond crystallography (SFX) is a new emerging method, where X-ray diffraction data are collected from a fully hydrated stream of nano- or microcrystals of biomolecules in their mother liquor using high-energy, X-ray free-electron lasers. The success of SFX experiments strongly depends on the ability to grow large amounts of well-ordered nano/microcrystals of homogeneous size distribution. While methods to grow large single crystals have been extensively explored in the past, method developments to grow nano/microcrystals in sufficient amounts for SFX experiments are still in their infancy. Here, we describe and compare three methods (batch, free interface diffusion (FID) and FID centrifugation) for growth of nano/microcrystals for time-resolved SFX experiments using the large membrane protein complex photosystem II as a model system.
Keywords: crystallization; femtosecond crystallography; free-electron laser; nanocrystals; photosystem II.
© 2014 The Author(s) Published by the Royal Society. All rights reserved.
Figures
Similar articles
-
Serial femtosecond crystallography opens new avenues for Structural Biology.Protein Pept Lett. 2016;23(3):255-72. doi: 10.2174/0929866523666160120152937. Protein Pept Lett. 2016. PMID: 26786767 Free PMC article.
-
Liquid sample delivery techniques for serial femtosecond crystallography.Philos Trans R Soc Lond B Biol Sci. 2014 Jul 17;369(1647):20130337. doi: 10.1098/rstb.2013.0337. Philos Trans R Soc Lond B Biol Sci. 2014. PMID: 24914163 Free PMC article. Review.
-
In vivo crystallography at X-ray free-electron lasers: the next generation of structural biology?Philos Trans R Soc Lond B Biol Sci. 2014 Jul 17;369(1647):20130497. doi: 10.1098/rstb.2013.0497. Philos Trans R Soc Lond B Biol Sci. 2014. PMID: 24914164 Free PMC article.
-
Crystallization of Photosystem II for Time-Resolved Structural Studies Using an X-ray Free Electron Laser.Methods Enzymol. 2015;557:459-82. doi: 10.1016/bs.mie.2015.01.011. Epub 2015 Apr 18. Methods Enzymol. 2015. PMID: 25950978 Free PMC article.
-
Femtosecond crystallography of membrane proteins in the lipidic cubic phase.Philos Trans R Soc Lond B Biol Sci. 2014 Jul 17;369(1647):20130314. doi: 10.1098/rstb.2013.0314. Philos Trans R Soc Lond B Biol Sci. 2014. PMID: 24914147 Free PMC article. Review.
Cited by
-
Segmented flow generator for serial crystallography at the European X-ray free electron laser.Nat Commun. 2020 Sep 9;11(1):4511. doi: 10.1038/s41467-020-18156-7. Nat Commun. 2020. PMID: 32908128 Free PMC article.
-
Growing Protein Crystals with Distinct Dimensions Using Automated Crystallization Coupled with In Situ Dynamic Light Scattering.J Vis Exp. 2018 Aug 14;(138):57070. doi: 10.3791/57070. J Vis Exp. 2018. PMID: 30175998 Free PMC article.
-
Serial femtosecond crystallography.Nat Rev Methods Primers. 2022 Aug 4;2:59. doi: 10.1038/s43586-022-00141-7. Nat Rev Methods Primers. 2022. PMID: 36643971 Free PMC article.
-
Strategies for sample delivery for femtosecond crystallography.Acta Crystallogr D Struct Biol. 2019 Feb 1;75(Pt 2):160-177. doi: 10.1107/S2059798318017953. Epub 2019 Feb 19. Acta Crystallogr D Struct Biol. 2019. PMID: 30821705 Free PMC article. Review.
-
Watching Proteins Function with Time-resolved X-ray Crystallography.J Phys D Appl Phys. 2017 Sep 20;50(37):373001. doi: 10.1088/1361-6463/aa7d32. Epub 2017 Aug 22. J Phys D Appl Phys. 2017. PMID: 29353938 Free PMC article.
References
Publication types
MeSH terms
Substances
Grants and funding
LinkOut - more resources
Full Text Sources
Other Literature Sources
Miscellaneous
