. 2014 Jul 17;369(1647):20130316.
doi: 10.1098/rstb.2013.0316.

Microcrystallization techniques for serial femtosecond crystallography using photosystem II from Thermosynechococcus elongatus as a model system

Affiliations

Microcrystallization techniques for serial femtosecond crystallography using photosystem II from Thermosynechococcus elongatus as a model system

Christopher Kupitz et al. Philos Trans R Soc Lond B Biol Sci. .

Abstract

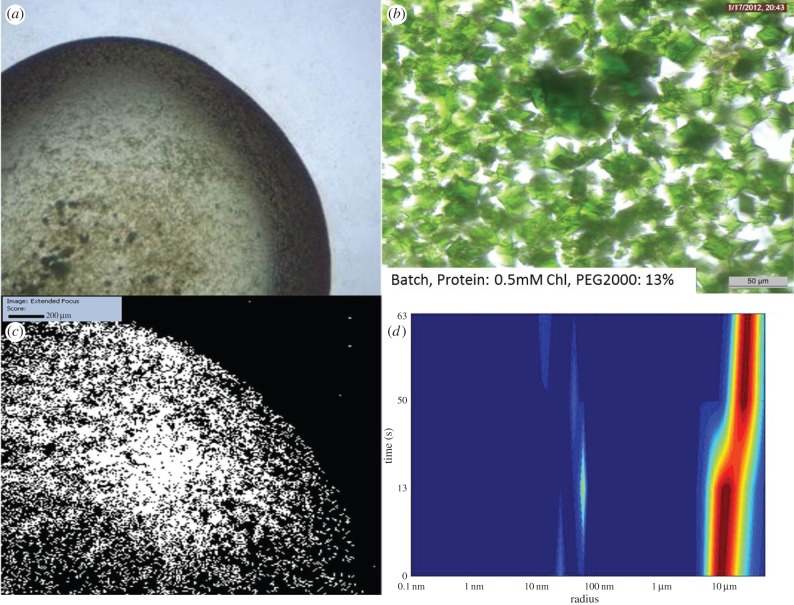
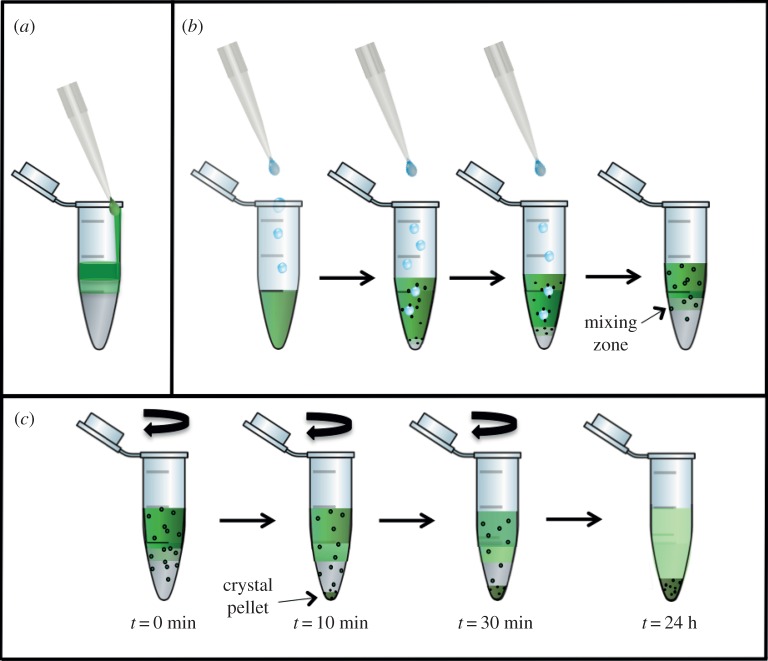
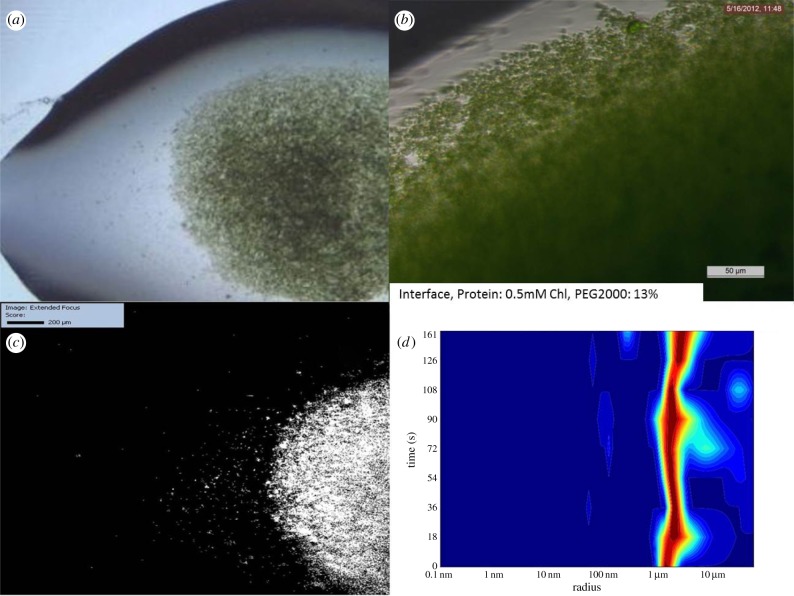
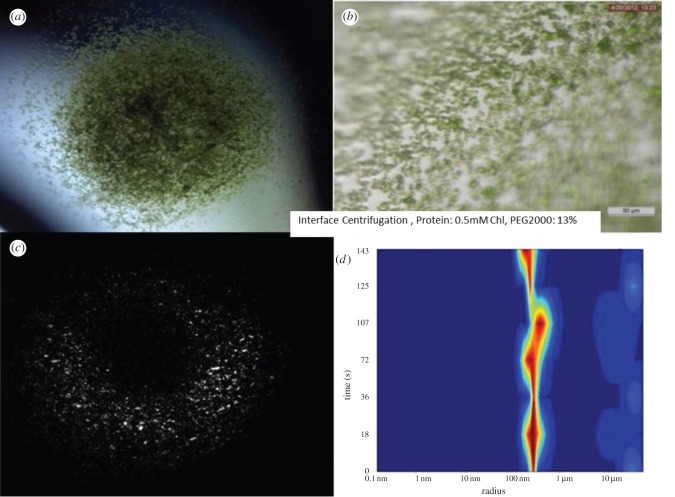
Serial femtosecond crystallography (SFX) is a new emerging method, where X-ray diffraction data are collected from a fully hydrated stream of nano- or microcrystals of biomolecules in their mother liquor using high-energy, X-ray free-electron lasers. The success of SFX experiments strongly depends on the ability to grow large amounts of well-ordered nano/microcrystals of homogeneous size distribution. While methods to grow large single crystals have been extensively explored in the past, method developments to grow nano/microcrystals in sufficient amounts for SFX experiments are still in their infancy. Here, we describe and compare three methods (batch, free interface diffusion (FID) and FID centrifugation) for growth of nano/microcrystals for time-resolved SFX experiments using the large membrane protein complex photosystem II as a model system.

Keywords: crystallization; femtosecond crystallography; free-electron laser; nanocrystals; photosystem II.


Figures

Figure 1.
Figure 1.
Photobioreactor developed for large-scale growth of photosynthetic algae and cyanobacteria. The reactor has a capacity of 122 l. It can be sterilized in situ and allows for control of light intensity, cell density, temperature, pH and gas flow.
Figure 2.
Figure 2.
Schematic phase diagram with suitable starting points for batch experiments. All batch experiments should ideally start in the nucleation zone. The nucleation rate increases with the increase of supersaturation, leading to a larger amount of crystals.
Figure 3.
Figure 3.
Batch method experiment performed using 0.5 mM Chl, and 13% PEG2000 as starting conditions. (a,b) Images of crystals created using the batch method. There are numerous large crystals, and these are obviously polycrystalline. (c) SONICC image of the entire drop of (b) confirming crystallinity. (d) DLS histogram showing that the majority of the crystals are around 10 μm radius.
Figure 4.
Figure 4.
Schematic of the set-up for crystallization experiments with FID (a,b) and FID centrifugation (c). (a) Experimental set-up in which the protein solution is carefully layered on top of the precipitant solution, where only few crystals form at the interface. (b) In the inverse set-up the precipitant solution is added dropwise to the protein solution, inducing increased transient nucleation at the drop–protein interface. (c) The experiment shown in (b) is continued by centrifugation. The nuclei formed in the protein solution are accelerated by centrifugation towards the interface zone, where they grow into nano- or microcrystals. When they reach a specific size they sediment into the precipitant zone, where they stop growing. Thereby nano- or microcrystals with a very narrow size distribution can be achieved.
Figure 5.
Figure 5.
FID experiment using 0.5 mM Chl and 13% PEG2000 as starting conditions. (a,b) Images of crystals created using the FID method, showing that crystals are significantly smaller and more uniform in size. (c) SONICC image of the drop of (a) confirming crystallinity. (d) DLS histogram indicating that the majority of the crystals are of 2–5 μm radius.
Figure 6.
Figure 6.
Free interface diffusion centrifugation experiment using 0.5 mM Chl and 13% PEG2000 as starting conditions. (a,b) Images of crystals showing that they are smaller and very uniform in size; they grow in approximately 30 min. (c) SONICC image of the entire drop of (b) confirming crystallinity. (d) DLS histogram showing that the majority of the crystals are around 500 nm radius.

References

    1. Moraes I, Evans G, Sanchez-Weatherby J, Newstead S, Stewart PD. 2014. Membrane protein structure determination—the next generation. Biochim. Biophys. Acta 1838, 78–87. ( 10.1016/j.bbamem.2013.07.010) - DOI - PMC - PubMed
    1. Schmidt M, Srajer V, Purwar N, Tripathi S. 2012. The kinetic dose limit in room-temperature time-resolved macromolecular crystallography. J. Synchrotron Radiat. 19, 264–273. ( 10.1107/S090904951105549X) - DOI - PMC - PubMed
    1. Yano J, et al. 2005. X-ray damage to the Mn4Ca complex in single crystals of photosystem II: a case study for metalloprotein crystallography. Proc. Natl Acad. Sci. USA 102, 12 047–12 052. ( 10.1073/pnas.0505207102) - DOI - PMC - PubMed
    1. Burmeister WP. 2000. Structural changes in a cryo-cooled protein crystal owing to radiation damage. Acta Crystallogr. D Biol. Crystallogr. 56, 328–341. ( 10.1107/S0907444999016261) - DOI - PubMed
    1. Chapman HN, et al. 2011. Femtosecond X-ray protein nanocrystallography. Nature 470, 73–77. ( 10.1038/nature09750) - DOI - PMC - PubMed

Publication types

Substances