

Methods development for diffraction and spectroscopy studies of metalloenzymes at X-ray free-electron lasers
- PMID: 24914169
- PMCID: PMC4052878
- DOI: 10.1098/rstb.2013.0590
Methods development for diffraction and spectroscopy studies of metalloenzymes at X-ray free-electron lasers
Abstract
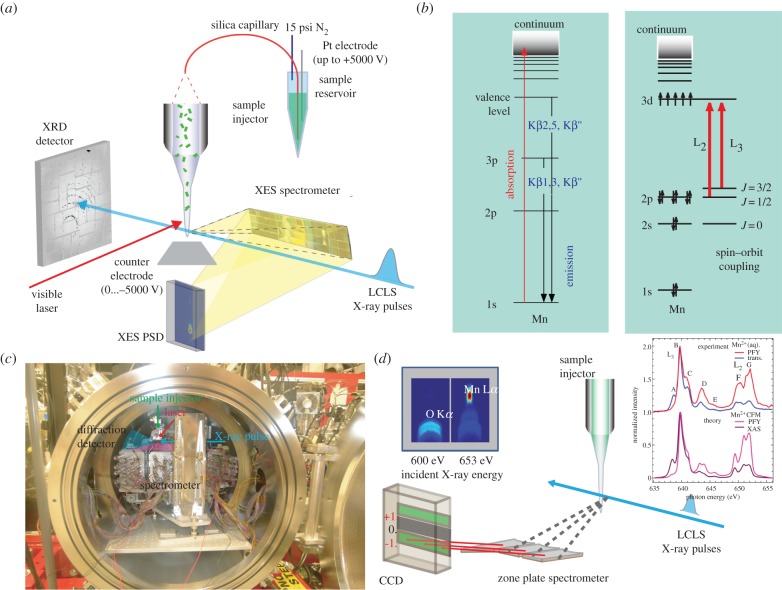
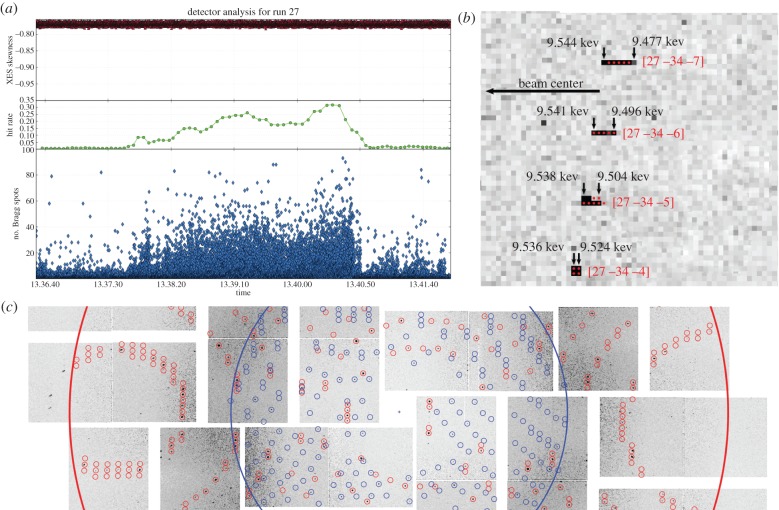
X-ray free-electron lasers (XFELs) open up new possibilities for X-ray crystallographic and spectroscopic studies of radiation-sensitive biological samples under close to physiological conditions. To facilitate these new X-ray sources, tailored experimental methods and data-processing protocols have to be developed. The highly radiation-sensitive photosystem II (PSII) protein complex is a prime target for XFEL experiments aiming to study the mechanism of light-induced water oxidation taking place at a Mn cluster in this complex. We developed a set of tools for the study of PSII at XFELs, including a new liquid jet based on electrofocusing, an energy dispersive von Hamos X-ray emission spectrometer for the hard X-ray range and a high-throughput soft X-ray spectrometer based on a reflection zone plate. While our immediate focus is on PSII, the methods we describe here are applicable to a wide range of metalloenzymes. These experimental developments were complemented by a new software suite, cctbx.xfel. This software suite allows for near-real-time monitoring of the experimental parameters and detector signals and the detailed analysis of the diffraction and spectroscopy data collected by us at the Linac Coherent Light Source, taking into account the specific characteristics of data measured at an XFEL.
Keywords: X-ray crystallography; X-ray emission spectroscopy; X-ray free-electron laser; metalloenzymes; photosystem II; water oxidation.
© 2014 The Author(s) Published by the Royal Society. All rights reserved.
Figures
Similar articles
-
The Mn₄Ca photosynthetic water-oxidation catalyst studied by simultaneous X-ray spectroscopy and crystallography using an X-ray free-electron laser.Philos Trans R Soc Lond B Biol Sci. 2014 Jul 17;369(1647):20130324. doi: 10.1098/rstb.2013.0324. Philos Trans R Soc Lond B Biol Sci. 2014. PMID: 24914152 Free PMC article.
-
Simultaneous femtosecond X-ray spectroscopy and diffraction of photosystem II at room temperature.Science. 2013 Apr 26;340(6131):491-5. doi: 10.1126/science.1234273. Epub 2013 Feb 14. Science. 2013. PMID: 23413188 Free PMC article.
-
X-ray Absorption Spectroscopy of Dilute Metalloenzymes at X-ray Free-Electron Lasers in a Shot-by-Shot Mode.J Phys Chem Lett. 2025 Apr 17;16(15):3778-3787. doi: 10.1021/acs.jpclett.5c00399. Epub 2025 Apr 7. J Phys Chem Lett. 2025. PMID: 40193717 Free PMC article.
-
Dynamic Structural Biology Experiments at XFEL or Synchrotron Sources.Methods Mol Biol. 2021;2305:203-228. doi: 10.1007/978-1-0716-1406-8_11. Methods Mol Biol. 2021. PMID: 33950392 Review.
-
Stimulated X-ray emission spectroscopy.Photosynth Res. 2024 Dec;162(2-3):371-384. doi: 10.1007/s11120-024-01080-y. Epub 2024 Apr 15. Photosynth Res. 2024. PMID: 38619702 Review.
Cited by
-
X-ray crystallography over the past decade for novel drug discovery - where are we heading next?Expert Opin Drug Discov. 2015;10(9):975-89. doi: 10.1517/17460441.2015.1061991. Epub 2015 Jul 15. Expert Opin Drug Discov. 2015. PMID: 26177814 Free PMC article. Review.
-
The Mn₄Ca photosynthetic water-oxidation catalyst studied by simultaneous X-ray spectroscopy and crystallography using an X-ray free-electron laser.Philos Trans R Soc Lond B Biol Sci. 2014 Jul 17;369(1647):20130324. doi: 10.1098/rstb.2013.0324. Philos Trans R Soc Lond B Biol Sci. 2014. PMID: 24914152 Free PMC article.
-
Assessment of microcrystal quality by transmission electron microscopy for efficient serial femtosecond crystallography.Arch Biochem Biophys. 2016 Jul 15;602:61-68. doi: 10.1016/j.abb.2016.02.011. Epub 2016 Mar 2. Arch Biochem Biophys. 2016. PMID: 26944553 Free PMC article. Review.
-
Choosing the optimal spectroscopic toolkit to understand protein function.Biosci Rep. 2017 Jun 8;37(3):BSR20160378. doi: 10.1042/BSR20160378. Print 2017 Jun 30. Biosci Rep. 2017. PMID: 28522552 Free PMC article.
-
Graphene-based microfluidics for serial crystallography.Lab Chip. 2016 Aug 2;16(16):3082-96. doi: 10.1039/c6lc00451b. Lab Chip. 2016. PMID: 27241728 Free PMC article.
References
-
- Emma P, et al. 2010. First lasing and operation of an angstrom-wavelength free-electron laser. Nat. Photon. 4, 641–647. (10.1038/nphoton.2010.176) - DOI
Publication types
MeSH terms
Substances
Grants and funding
LinkOut - more resources
Full Text Sources
Other Literature Sources
