The role of IL-17 promotes spinal cord neuroinflammation via activation of the transcription factor STAT3 after spinal cord injury in the rat
- PMID: 24914249
- PMCID: PMC4021861
- DOI: 10.1155/2014/786947
The role of IL-17 promotes spinal cord neuroinflammation via activation of the transcription factor STAT3 after spinal cord injury in the rat
Abstract
Study design: In this study, we investigated the role of IL-17 via activation of STAT3 in the pathophysiology of SCI.
Objective: The purpose of the experiments is to study the expression of IL-17 and related cytokines via STAT3 signaling pathways, which is caused by the acute inflammatory response following SCI in different periods via establishing an acute SCI model in rat.
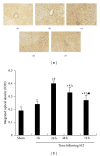
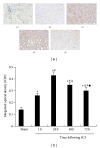
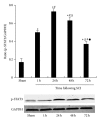
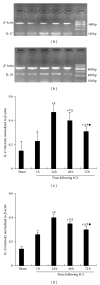
Methods: Basso, Beattie, and Bresnahan hind limb locomotor rating scale was used to assess the rat hind limb motor function. Immunohistochemistry was used to determine the expression levels of IL-17 and p-STAT3 in spinal cord tissues. Western blotting analysis was used to determine the protein expression of p-STAT3 in spinal cord tissue. RT-PCR was used to analyze the mRNA expression of IL-17 and IL-23p19 in the spleen tissue. ELISA was used to determine the peripheral blood serum levels of IL-6, IL-21, and IL-23.
Results: Compared to the sham-operated group, the expression levels of IL-17, p-STAT3, IL-6, IL-21, and IL-23 were significantly increased and peaked at 24 h after SCI. The increased levels of cytokines were correlated with the SCI disease stages.
Conclusion: IL-17 may play an important role in promoting spinal cord neuroinflammation after SCI via activation of STAT3.
Figures


Similar articles
-
MiR-21 inhibitor improves locomotor function recovery by inhibiting IL-6R/JAK-STAT pathway-mediated inflammation after spinal cord injury in model of rat.Eur Rev Med Pharmacol Sci. 2019 Jan;23(2):433-440. doi: 10.26355/eurrev_201901_16852. Eur Rev Med Pharmacol Sci. 2019. PMID: 30720148
-
[Therapeutic mechanism of basic fibroblast growth factor on spinal cord injury in rats based on the Notch/signal transducer and activator of transcription 3 signaling pathway].Zhongguo Xiu Fu Chong Jian Wai Ke Za Zhi. 2024 Apr 15;38(4):480-486. doi: 10.7507/1002-1892.202312066. Zhongguo Xiu Fu Chong Jian Wai Ke Za Zhi. 2024. PMID: 38632070 Free PMC article. Chinese.
-
Treadmill training improves neural function recovery in rats with spinal cord injury via JAK2/STAT3 signaling pathway and attenuating apoptosis.Neuroreport. 2024 Sep 4;35(13):811-821. doi: 10.1097/WNR.0000000000002062. Epub 2024 Jul 8. Neuroreport. 2024. PMID: 38973489
-
Lentivirus-mediated downregulation of α-synuclein reduces neuroinflammation and promotes functional recovery in rats with spinal cord injury.J Neuroinflammation. 2019 Dec 30;16(1):283. doi: 10.1186/s12974-019-1658-2. J Neuroinflammation. 2019. PMID: 31888724 Free PMC article.
-
Electroacupuncture stimulation inhibited astrogliosis and microglia polarisation to alleviate spinal cord injury via Janus kinase 2/signal transducer and activator of transcription 3 signalling pathway.Folia Histochem Cytobiol. 2025;63(1):28-40. doi: 10.5603/fhc.104273. Folia Histochem Cytobiol. 2025. PMID: 40421823
Cited by
-
Interleukin-17 as a potential therapeutic target for chronic pain.Front Immunol. 2022 Sep 29;13:999407. doi: 10.3389/fimmu.2022.999407. eCollection 2022. Front Immunol. 2022. PMID: 36248896 Free PMC article. Review.
-
IL-17A is implicated in lipopolysaccharide-induced neuroinflammation and cognitive impairment in aged rats via microglial activation.J Neuroinflammation. 2015 Sep 15;12:165. doi: 10.1186/s12974-015-0394-5. J Neuroinflammation. 2015. PMID: 26373740 Free PMC article.
-
Inhibition of RNF6 alleviates traumatic brain injury by suppressing STAT3 signaling in rats.Brain Behav. 2020 Dec;10(12):e01847. doi: 10.1002/brb3.1847. Epub 2020 Sep 21. Brain Behav. 2020. PMID: 32955171 Free PMC article.
-
Neutrophil-derived interleukin-17A participates in neuroinflammation induced by traumatic brain injury.Neural Regen Res. 2023 May;18(5):1046-1051. doi: 10.4103/1673-5374.355767. Neural Regen Res. 2023. PMID: 36254991 Free PMC article.
-
Patients with Chronic Spinal Cord Injury and a Long Period of Evolution Exhibit an Altered Cytokine Production by CD4 and CD8 T Cell Populations.Int J Mol Sci. 2023 Apr 11;24(8):7048. doi: 10.3390/ijms24087048. Int J Mol Sci. 2023. PMID: 37108209 Free PMC article.
References
-
- Filli L, Schwab ME. The rocky road to translation in spinal cord repair. Annals of Neurology. 2012;72(4):491–501. - PubMed
-
- Jian L, Guozhong L. Research progress of Th17 cells in nervous system diseases. Immunology Journal. 2013;29(005):442–446.
-
- Korn T, Bettelli E, Oukka M, Kuchroo VK. IL-17 and Th17 cells. Annual Review of Immunology. 2009;27:485–517. - PubMed
-
- Bettelli E, Oukka M, Kuchroo VK. TH-17 cells in the circle of immunity and autoimmunity. Nature Immunology. 2007;8(4):345–350. - PubMed
Publication types
MeSH terms
Substances
LinkOut - more resources
Full Text Sources
Other Literature Sources
Medical
Miscellaneous

