. 2014 Jun 9;29(5):562-576.
doi: 10.1016/j.devcel.2014.03.023.

A dynamic microtubule cytoskeleton directs medial actomyosin function during tube formation

Affiliations

A dynamic microtubule cytoskeleton directs medial actomyosin function during tube formation

Alexander J R Booth et al. Dev Cell. .

Abstract

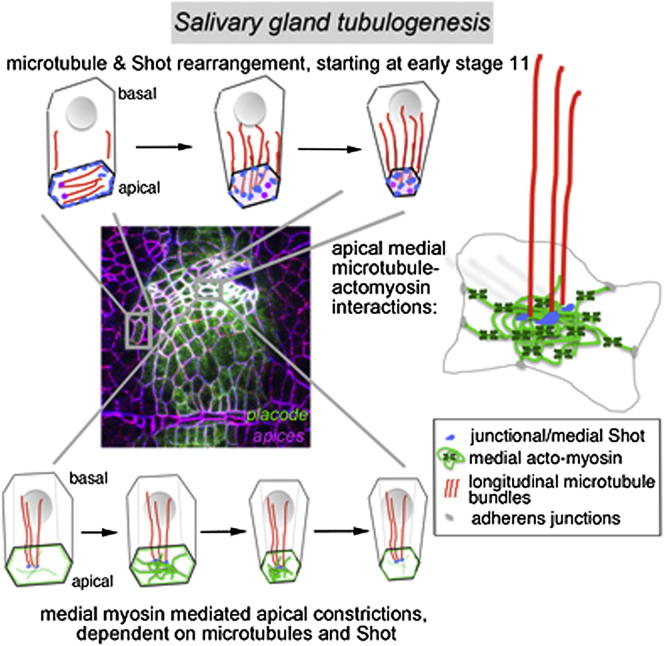
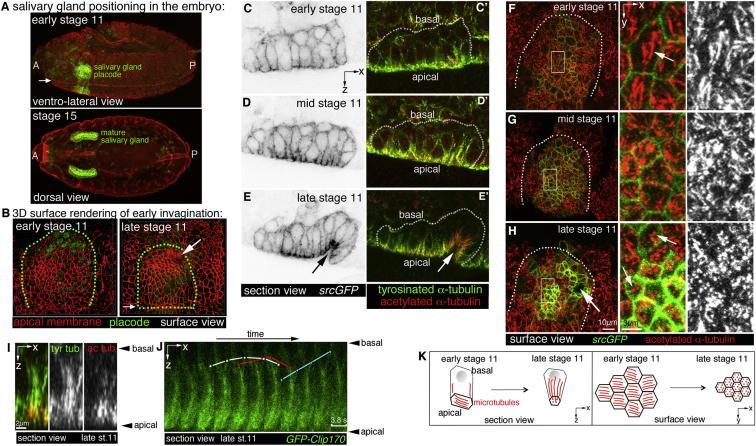
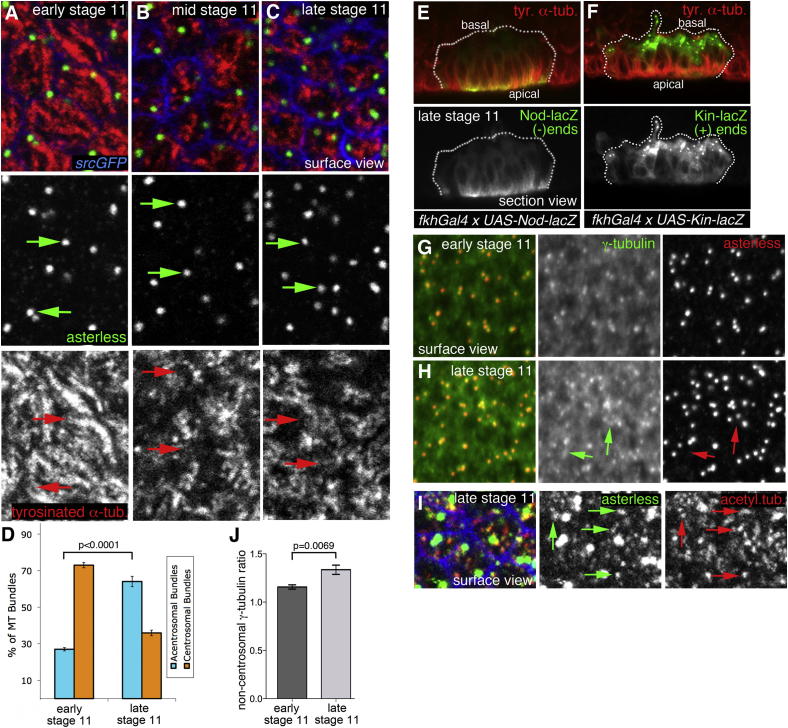
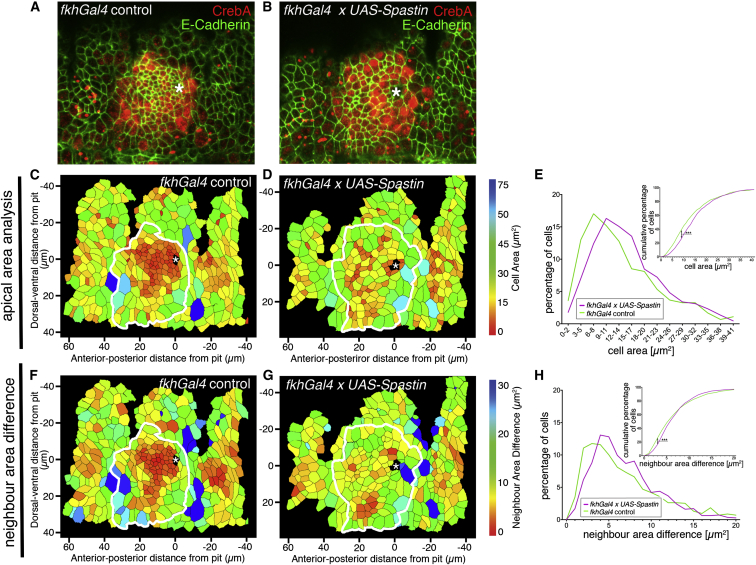
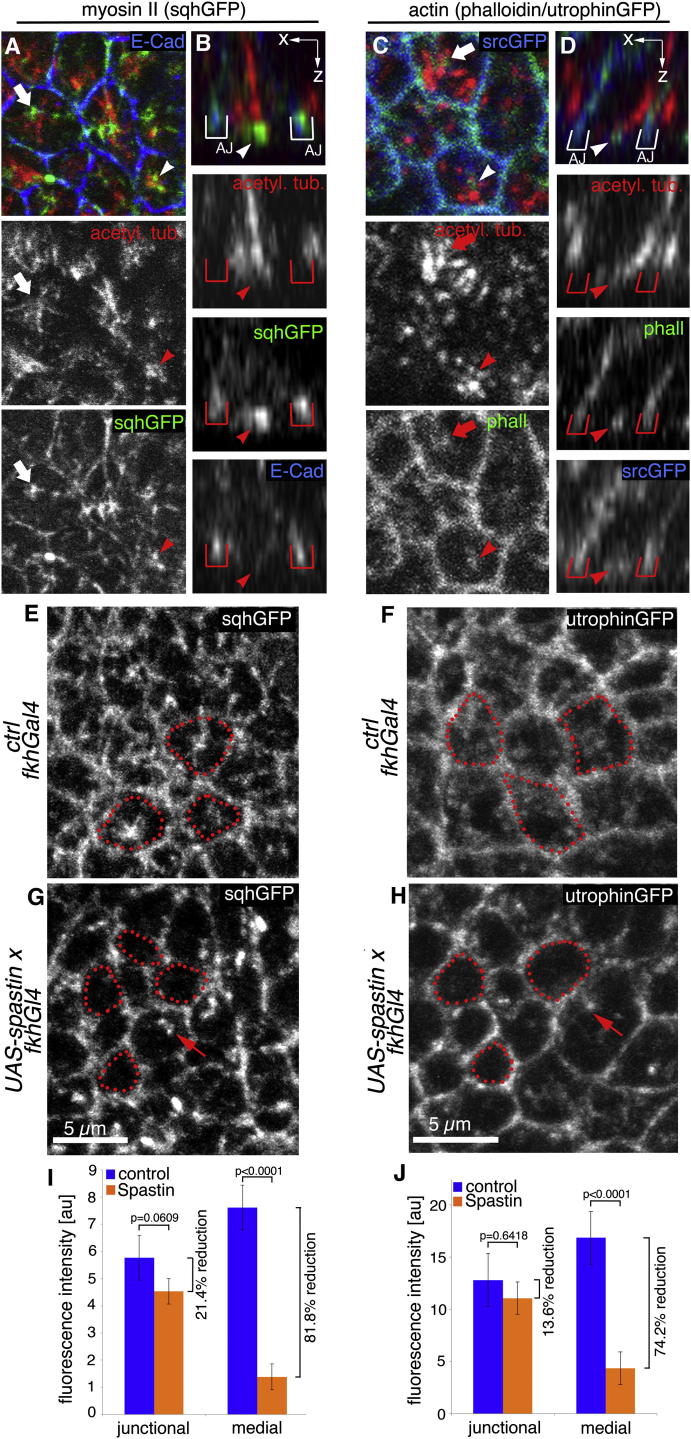
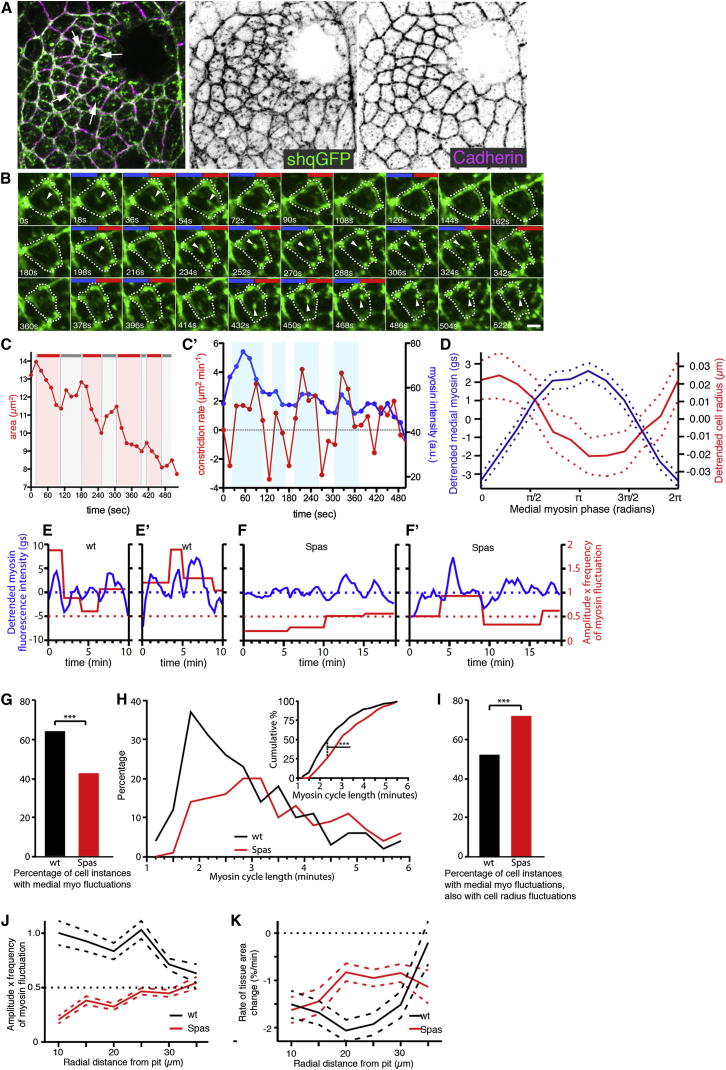
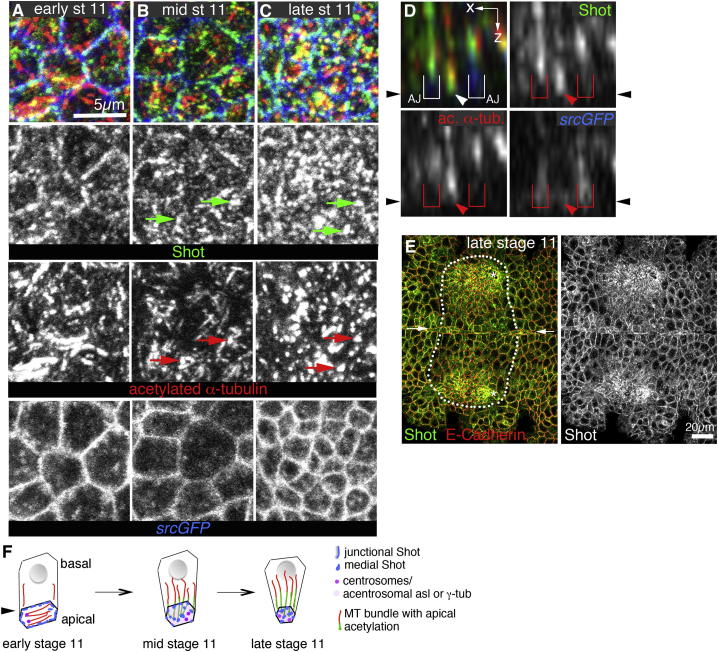
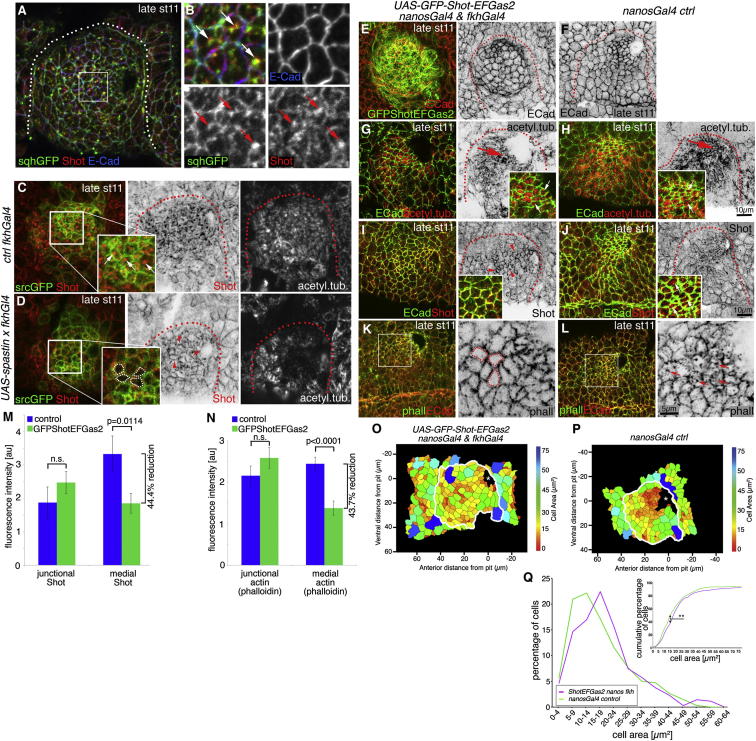
The cytoskeleton is a major determinant of cell-shape changes that drive the formation of complex tissues during development. Important roles for actomyosin during tissue morphogenesis have been identified, but the role of the microtubule cytoskeleton is less clear. Here, we show that during tubulogenesis of the salivary glands in the fly embryo, the microtubule cytoskeleton undergoes major rearrangements, including a 90° change in alignment relative to the apicobasal axis, loss of centrosomal attachment, and apical stabilization. Disruption of the microtubule cytoskeleton leads to failure of apical constriction in placodal cells fated to invaginate. We show that this failure is due to loss of an apical medial actomyosin network whose pulsatile behavior in wild-type embryos drives the apical constriction of the cells. The medial actomyosin network interacts with the minus ends of acentrosomal microtubule bundles through the cytolinker protein Shot, and disruption of Shot also impairs apical constriction.


Figures

None
Graphical abstract
Figure 1
Figure 1
Microtubule Rearrangements during Early Salivary Gland Invagination (A) Confocal stacks illustrating the position of the salivary gland placode at early stage 11 (top panel; green) and of the fully invaginated glands at stage 15 (lower panel; green). A, anterior; P, posterior. (B) 3D rendering of apical cortices marked by Crumbs illustrates the early invagination of placodal cells (green), processing from a flat epithelial sheet at early stage 11 (left) to an early invaginated pit at late stage 11 (right). Small arrows in (A) and (B) point to the ventral midline; large arrow in (B) points to the forming pit; green dotted lines in (B) mark the placode area. (C–E′) Lateral section views of placodal cells at early stage 11 before apical constriction (C), midstage 11 during constriction but before invagination (D), and late stage 11 after initial invagination (E). srcGFP (under control of fkhGal4) is shown in inverse panels (C)–(E) to outline membranes of placodal cells. Labeling for tyrosinated α-tubulin (green in C′–E′) and acetylated α-tubulin (red in C′–E′) reveals that the number of MTs projecting from the apical surface into the cells increases during early constriction and invagination. The arrows in (E) and (E′) point to the invaginating pit. (F–H) Surface views of placodes showing that MTs undergo a 90° rearrangement during cell constriction. At early stage 11, labeling for acetylated α-tubulin (red) shows a dense MT network lying parallel to the apical surface of the cells (F). During midstage 11, these MT bundles change orientation (G) to run perpendicular to the apical surface as longitudinal bundles by late stage 11 (H). Constricting apices are marked by srcGFP in green. White boxes indicate areas magnified in the center and right panels; small arrows point to apical parallel MTs (F) and the end foci of longitudinal bundles (H); large arrow points to the invaginating pit; white dotted lines mark the placode area. (I) z section of an MT bundle, with the level of acetylation of MTs being greater nearer the apical surface. Acetylated α-tubulin, red; tyrosinated α-tubulin, green. (J) Kymograph of a z section time-lapse analysis of microtubule dynamics in an invaginating cell at late stage 11; MTs are visualized using GFP-Clip170; frames are 3.87 s apart (see Movie S1). White, blue, and red dots mark individual MTs emanating from the bundle. (K) Schematic of MT rearrangements in the placode during stage 11. See also Figure S1 and Movie S1.
Figure 2
Figure 2
Microtubules Change from Centrosomal to Acentrosomal Nucleation/Anchoring during Early Invagination (A–C) Surface projections show that at early stage 11, the ends of many apical MTs colocalize with the centrosomal protein asterless (A), but through midstage 11 this changes (B) so that by late stage 11, centrosomes labeled by asterless less frequently colocalize with MT foci (C). Asterless, green; tyrosinated α-tubulin, red; srcGFP, blue. Arrows point to centrosomes and the matching positions in the MT channel. (D) Quantification of colocalization of MT bundle ends and centrosomes at early and late stage 11 (350 MT bundles from six different placodes for each stage; shown are mean ± SEM, p < 0.0001 using Student’s t test; see Table S1). (E and F) Section views of late stage 11 placodes: Nod-LacZ, a marker of MT (−) ends (E, green), accumulates apically in a flat region of a placode, indicating that MT (−) ends are located apically, whereas an MT (+) end marker, Kin-LacZ, is found basally (F, green). Tyrosinated α-tubulin, red. The white dotted lines mark placodal cells. (G and H) In surface projections of placodal cells, γ-tubulin becomes less tightly centrosome associated from early stage 11 to late stage 11. At early stage 11, the brightest γ-tubulin foci (green) colocalize with centrosomes (red) labeled by asterless (G). At late stage 11, in addition to centrosome foci, further noncentrosomal densities of γ-tubulin labeling have appeared within the placode (H, green arrows), not colocalizing with centrosomes marked by asterless. Panels are higher magnifications of boxes in Figures S1E and S1G. (I) When asterless labeling (green) at late stage 11 is analyzed at higher laser power, it shows, in addition to strong labeling of centrosomes, many fainter acentrosomal foci that colocalize with apical MT foci (arrows). Acetylated α-tubulin, red; srcGFP, blue. (J) Quantification of the mean noncentrosomal γ-tubulin fluorescence inside versus outside the placode (six placodes were analyzed for each stage; shown are mean ± SEM, p = 0.0069 using Student’s t test; see Table S1). See also Figure S1.
Figure 3
Figure 3
Depletion of the Microtubule Network Disrupts Apical Area Constriction in the Placode (A and B) The MT cytoskeleton was depleted using expression of UAS-Spastin under fkhGal4 control. Representative surface view images of control (A) and MT-depleted (B) placodes at late stage 11, with E-cadherin (green) labeling cell outlines and CrebA (red) marking the cells of the placode. Asterisks denote the invagination point. (C and D) Heat maps corresponding to (A) and (B), respectively, indicating apical surface area size determined through automated tracing of E-cadherin-labeled cell boundaries. White lines denote the border of the placode (determined from CrebA labeling). (E) Quantification of apical area size in MT-depleted (fkhGal4 x UAS-Spastin) and control (fkhGal4) placodes at late stage 11, showing both the percentage of cells in different-size bins (large graph) and the cumulative percentage of cells relative to apical area size (inset: ∗∗∗p << 0.001 using Kolmogorov-Smirnov two-sample test; see Table S1). Ten placodes were segmented and analyzed for each condition; the total number of cells traced was N(fkhGal4) = 1,198 and N(fkhGal4 x UAS-Spastin) = 1,122. (F and G) Heat maps corresponding to (A) and (B), respectively, indicating the difference in apical surface area size between any given cell and its direct neighbors. (H) Quantification of (F) and (G) as for apical area differences above (N(fkhGal4) = 1,148, N(fkhGal4 x UAS-Spastin) = 1,117; inset: ∗∗∗p << 0.001 using Kolmogorov-Smirnov two-sample test; see Table S1). See also Figure S2.
Figure 4
Figure 4
Loss of Microtubules Leads to Loss of the Apical Medial Actomyosin Network (A–D) Longitudinal MT bundles at late stage 11 terminate apically at foci of medial myosin (surface view, A; z section, B) and F-actin (surface view, C; z section, D). Acetylated α-tubulin, red; sqhGFP, green; phalloidin, green; E-cadherin, blue (A and B); srcGFP, blue (C and D). The arrows and arrowheads point to colocalization of MTs and medial actomyosin; the arrowheads in (A) and (C) point to the bundle that is displayed in the z sections in (B) and (D). Red brackets indicate positions of adherens junctions (AJ). (E–H) MT depletion using UAS-Spastin and fkhGal4 disrupts the apical medial actomyosin network. Comparison of sqhGFP and utrophinGFP (to label actin) in control (E and F) and MT-depleted (G and H) placodes (the panels are higher magnifications of the boxes indicated in Figure S3). Red dotted lines highlight medial apical domains; arrows point to a myosin or actin remnant upon MT depletion. (I and J) Quantification of the effect of MT depletion on junctional and medial myosin (I), using sqhGFP, and actin (J), using utrophinGFP. Shown are mean ± SEM of placodal fluorescence intensity above epidermal base level; difference for junctional myosin is p = 0.0609 and for medial myosin is p < 0.0001, and for junctional actin is p = 0.6418 and for medial actin is p < 0.0001 using Student’s t test (see Table S1). See also Figure S3.
Figure 5
Figure 5
An Apical Medial Actomyosin Network Involved in Apical Constriction during Tubulogenesis (A) Myosin II (sqhGFP, green) is organized into an apical junctional and apical medial network across the salivary gland placode (Röper, 2012). The junctional myosin colocalizes with cadherin (magenta), and the medial myosin forms a network-like arrangement across many neighboring cells (arrows). (B) Still frames of a time-lapse movie of a sqhAX3; sqh::sqhGFP42 embryo (see Figure S4A; Movie S2). The still frames show the fluctuations of medial myosin and the position of the cell cortex (dotted lines) of an exemplary placodal cell; arrowheads point to dynamic, pulsatile concentrations of myosin; blue bars indicate increased myosin II; red bars indicate increased constriction (see C′). The scale bar represents 2 μm. (C) Apical cell area (μm2) decreases in discrete pulses (red bars) followed by a period of relaxation and stabilization (gray bars). (C′) Quantification of the constriction rate (μm2 min−1; red) in comparison to medial myosin II intensity (blue) for a single exemplary cell in a placode. An increase in medial myosin II intensity is closely correlated with an increase in constriction rate. (D) Average medial myosin fluorescence (with trends removed; blue line; gs, grayscale) and cell radius (with trends removed; red line) plotted against phase of medial myosin fluctuation cycle. Two hundred and twelve full cycles of myosin (trough to trough) were pooled and averaged from nine wild-type embryo movies. Dotted lines show 95% confidence intervals. (E and F) Myosin fluorescence intensity (with trends removed, blue lines) and strength of myosin fluctuation (expressed as amplitude × frequency; red lines) for sample cells. Dotted red lines show the threshold value above which the strength of myosin activity was defined as being periodic. (E and E′) Two sample wild-type cells (WT). (F and F′) Two sample MT-depleted cells (Spas). Longer traces are shown for MT-depleted cells because of their longer cycle lengths. (G–K) Comparison of the average behavior of nine control (wild-type; black) and three MT-depleted embryos (Spas; red). For control embryo data, the number of tracked cell instances (see text) for which it could be established whether a cell was fluctuating or not was 2,877, of which 1,849 exhibited myosin fluctuations. Of the latter, apical radius fluctuated in 929. For MT-depleted embryo data, the number of cell instances was 3,711, 1,584, and 1,106, respectively. See Table S1 for details of statistical analysis. (G) Percentage of tracked placode cell instances for which medial myosin fluctuations could be detected (see also Movies S3 and S4). ∗∗∗p << 0.0001 using G test of independence. (H) Distribution of cycle lengths of cells showing myosin fluctuations. Inset: cumulative histograms indicating that cycle lengths of cells still showing fluctuations upon MT depletion were significantly increased. ∗∗∗p << 0.0001 using Kolmogorov-Smirnov test. (I) Percentage of cell instances with medial myosin fluctuations for which cell-radius fluctuations could also be detected. ∗∗∗p << 0.0001 using G test of independence. (J) Average strength of myosin fluctuation versus radial coordinate relative to the pit center. Dashed lines are 95% confidence intervals for pooled cell data. Dotted line at 0.5 amplitude × frequency marks the threshold below which cells were not considered to be periodic. (K) Average rate of change of tissue area versus radial coordinate relative to the pit center (same data as shown in Figures S4E and S4F). Dashed lines show respective 95% confidence intervals. See also Figures S4 and S5 and Movies S2, S4, and S5.
Figure 6
Figure 6
The Cytolinker Shot Relocalizes from the Cell Junctions to the Apical Ends of Microtubule Bundles during Early Invagination (A–C) The spectraplakin Shot contains actin-binding and MT-binding domains (see Figure S6A). At early stage 11, the majority of Shot (green) localizes to the cell cortex as described in other epithelia (A) (Röper and Brown, 2003), but during midstage 11, Shot relocalizes (B) to then colocalize with the ends of longitudinal MT bundles (red) by late stage 11 (C); shown are surface views. Arrows in (B) and (C) point to colocalization between Shot and MT foci. (D) z sections show Shot (green) localized at the end of an MT bundle (red). Eighty-three percent of MT bundles terminate in an apical focus of Shot (see Figure S6F). The arrowheads indicate the end of a microtubule bundle; the brackets indicate the positions of adherens junctions. (E) Overview surface scan at late stage 11 clearly shows the change in Shot localization (green) within the constricting secretory part of the placodes (marked by white dotted lines) compared to junctional Shot outside that placode that colocalizes with E-cadherin (red). Small arrows indicate the ventral midline. (F) Schematic of coordinated MT and Shot reorganization during early constriction. Black arrowheads in (D) and (F) indicate position of the apical domain. See also Figure S6.
Figure 7
Figure 7
Shot Links Microtubules to Medial Actomyosin, and Medial Shot Is Required for Apical Constriction (A and B) At late stage 11, medial Shot (red) colocalizes with medial myosin (sqhGFP, green). The area marked by the white box in (A) is shown enlarged in (B). Arrows point to sqhGFP-Shot colocalization. (C and D) Depletion of MTs in the placode leads to a failure to relocalize Shot from the junctions to the apical medial region of placodal cells. In contrast to a control placode (C), where Shot (red) is localized to the apical medial region (see arrows in the inset), when MTs (acetylated α-tubulin) are depleted using UAS-Spastin and fkhGal4 (D), Shot remains associated with the junctional area (green, srcGFP) in the placodal cells (inset: dotted lines mark medial regions of cells; arrowheads point to junctional Shot; quantified in Figure S7G). (E and F) Overexpression of GFP-Shot-EFGas2 using nanosGal4 and fkhGal4 interferes with apical constriction (E) compared to the control (F). E-cadherin, red and as a single channel in (E) and (F); GFP-Shot-EFGas2, green in (E). (F) The single E-cadherin channel of the panel shown as a composite in (L). (G and H) MTs rearrange and appear stabilized when GFP-Shot-EFGas2 is overexpressed (G) as in the control (H). Insets: MT bundle ends marked by acetylated α-tubulin (red; arrows) in between cell cortices marked by E-cadherin (green). (I and J) Endogenous Shot (red) remains cortical when GFP-Shot-EFGas2 is overexpressed (I; red arrowheads) in contrast to the control, where Shot relocalizes to medial MT ends (J). Insets: Shot colocalizing with junctional E-cadherin (green) upon GFP-Shot-EFGas2 expression (I), in contrast to medial Shot accumulations in the control (J; arrows). Shot levels are quantified in (M). Dotted lines in (A)–(J) mark the area of the placode, unless indicated otherwise. (K and L) Placodes overexpressing GFP-Shot-EFGas2 often show reduced medial F-actin (K) compared to controls (L). Phalloidin (labeling F-actin; red in K and L and as a single channel in inverse panels); E-cadherin, green; white boxes mark areas magnified in inverse panels; dotted lines mark cells with no medial F-actin; arrows point to medial F-actin in the control. F-actin is quantified in (N). (M and N) Quantification of the effect of GFP-Shot-EFGas2 overexpression on junctional and medial Shot (M) and actin (N; using phalloidin). Shown are mean ± SEM of placodal fluorescence intensity above epidermal base level; difference for junctional Shot is p = 0.2932 and for medial Shot is p = 0.0114, and for junctional actin is p = 0.2134 and for medial actin is p < 0.0001, using Student’s t test; n.s., nonsignificant (see Table S1). (O and P) Exemplary heat maps indicating the apical surface area size of UAS-GFP-Shot-EFGas2-expressing embryos (nanosGal4 and fkhGal4 control; M) and of control embryos (N) determined through automated segmentation of E-cadherin-labeled cell boundaries. The white lines denote the border of the placode. Asterisks denote the invagination point. (Q) Quantification of the apical area size in GFP-Shot-EFGas2-expressing (using fkhGal4 and nanosGal4VP16) and control (nanosGal4VP16) placodes at late stage 11, showing both percentage of cells in different-size bins (large graph) as well as the cumulative percentage of cells relative to apical area size (inset: Kolmogorov-Smirnov two-sample test, ∗∗p << 0.01; see Table S1). For GFP-Shot-EFGas2 expression, four placodes, and for the control, three placodes were segmented and analyzed, and the total number of cells traced was N(nanosGal4) = 339 and N(UAS-GFP-Shot-EFGas2 nanosGal4 & fkhGal4) = 348. See also Figure S6.

Similar articles

Cited by

References

    1. Akhmanova A., Stehbens S.J., Yap A.S. Touch, grasp, deliver and control: functional cross-talk between microtubules and cell adhesions. Traffic. 2009;10:268–274. - PubMed
    1. Andrew D.J., Ewald A.J. Morphogenesis of epithelial tubes: Insights into tube formation, elongation, and elaboration. Dev. Biol. 2010;341:34–55. - PMC - PubMed
    1. Bartolini F., Gundersen G.G. Generation of noncentrosomal microtubule arrays. J. Cell Sci. 2006;119:4155–4163. - PubMed
    1. Basu R., Chang F. Shaping the actin cytoskeleton using microtubule tips. Curr. Opin. Cell Biol. 2007;19:88–94. - PubMed
    1. Bertet C., Sulak L., Lecuit T. Myosin-dependent junction remodelling controls planar cell intercalation and axis elongation. Nature. 2004;429:667–671. - PubMed

Publication types

MeSH terms

LinkOut - more resources