. 2014 Jun 10;9(6):e99443.
doi: 10.1371/journal.pone.0099443. eCollection 2014.

Reduced inflammatory phenotype in microglia derived from neonatal rat spinal cord versus brain

Affiliations

Reduced inflammatory phenotype in microglia derived from neonatal rat spinal cord versus brain

Sam Joshva Baskar Jesudasan et al. PLoS One. .

Abstract

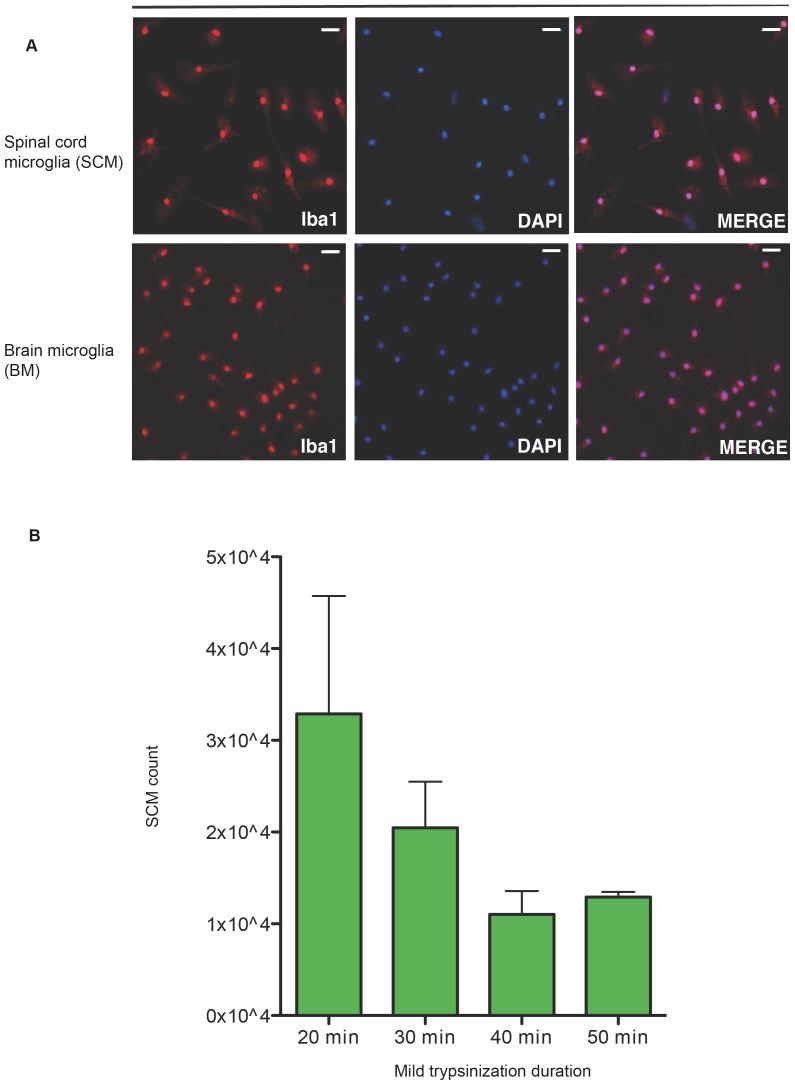
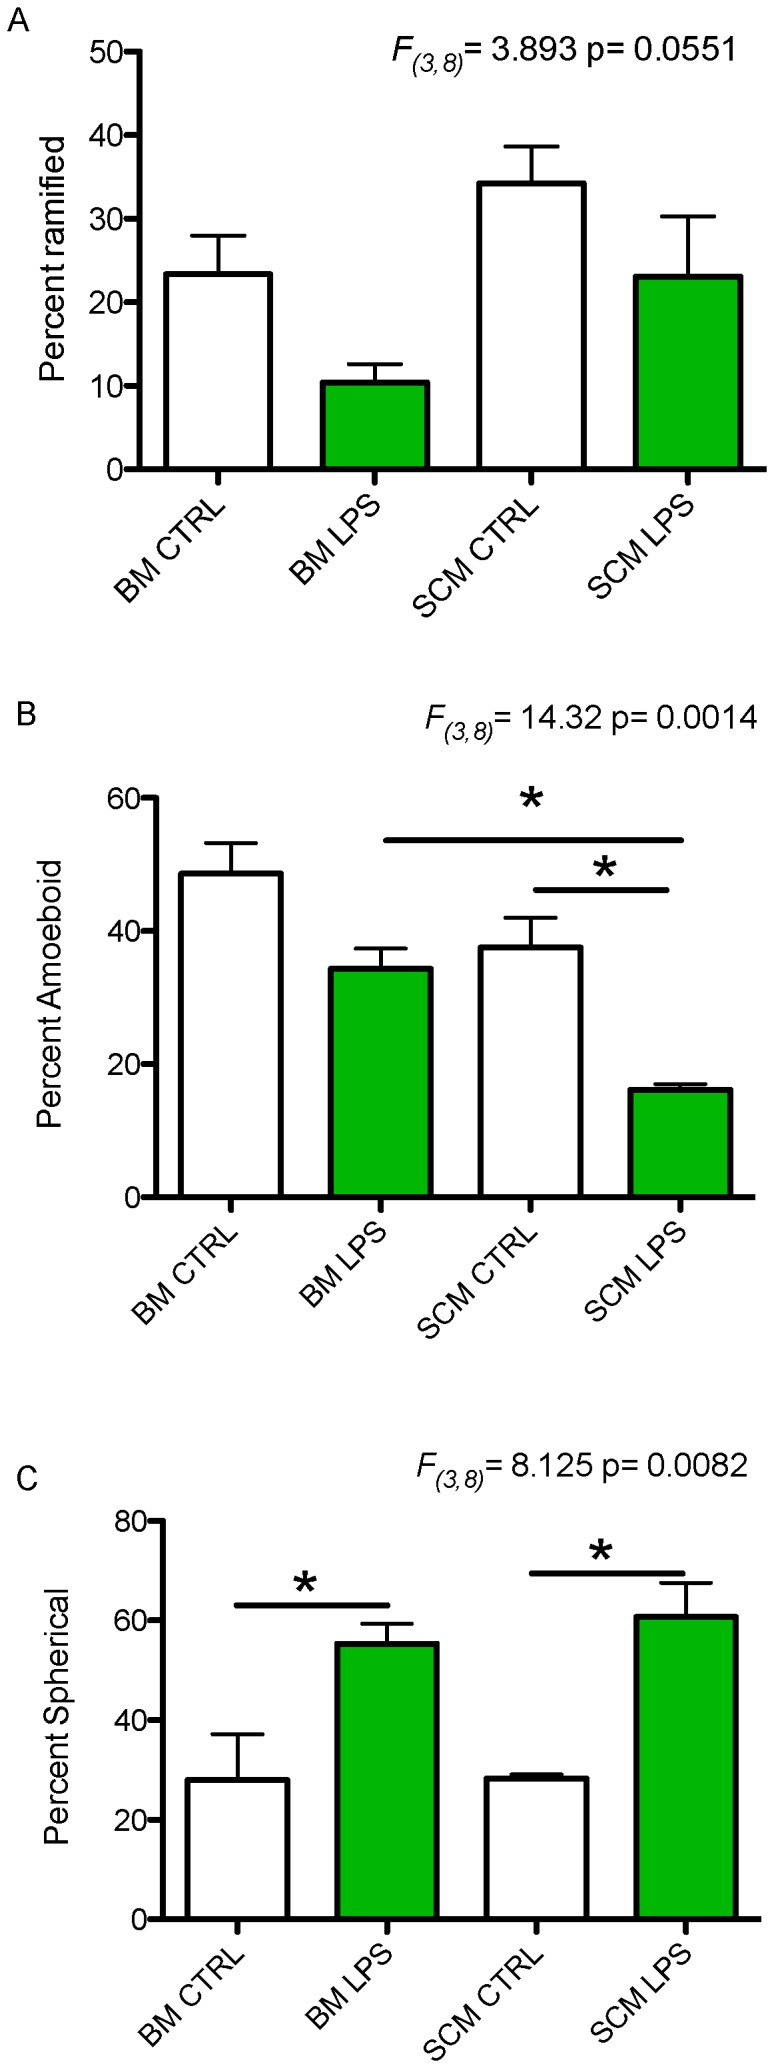
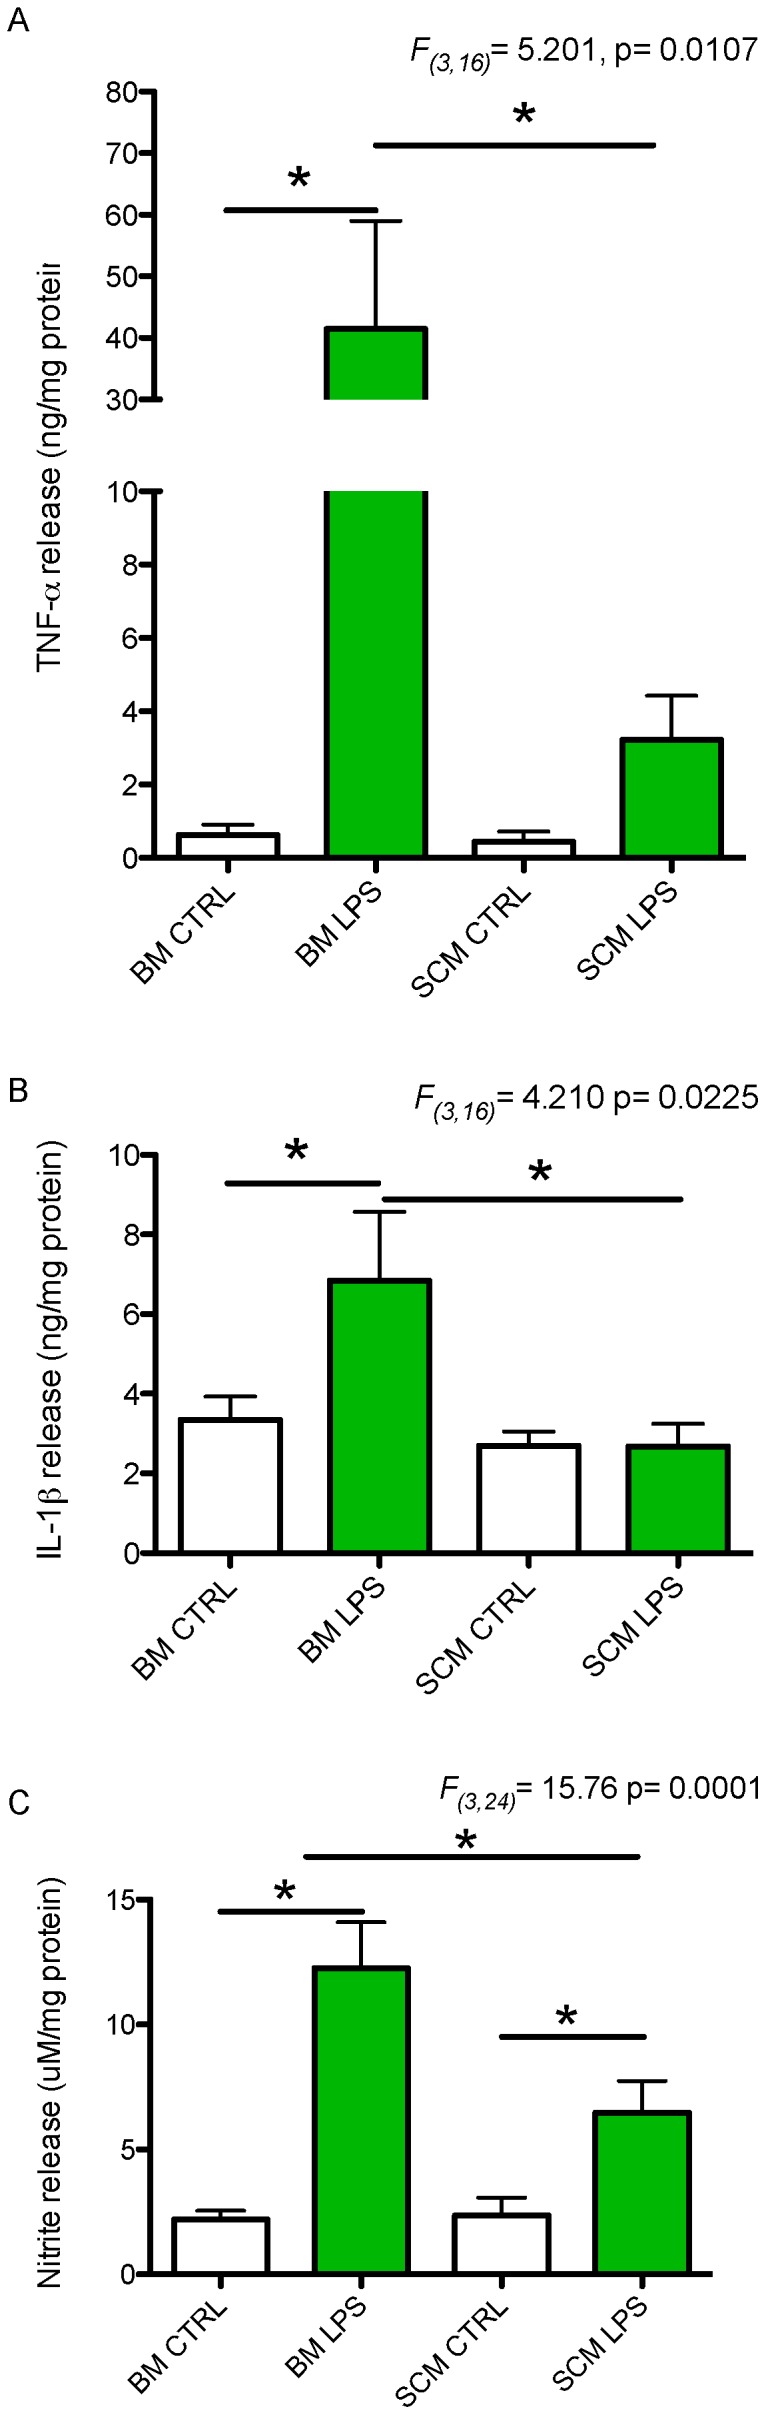
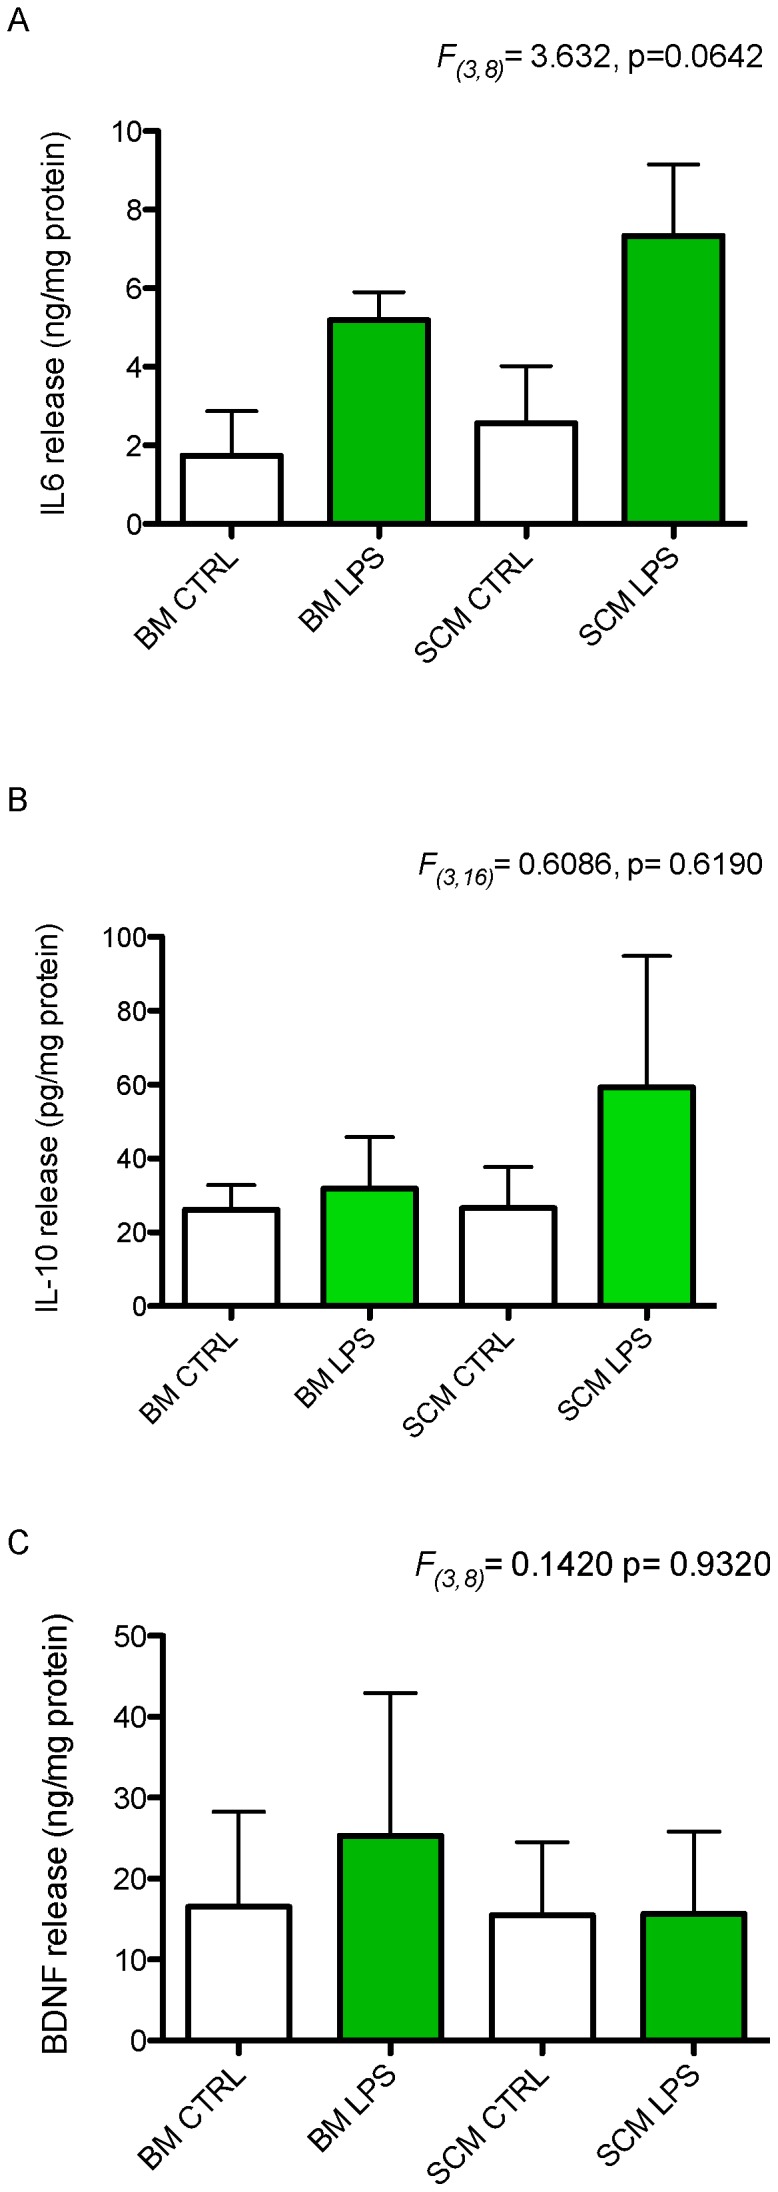
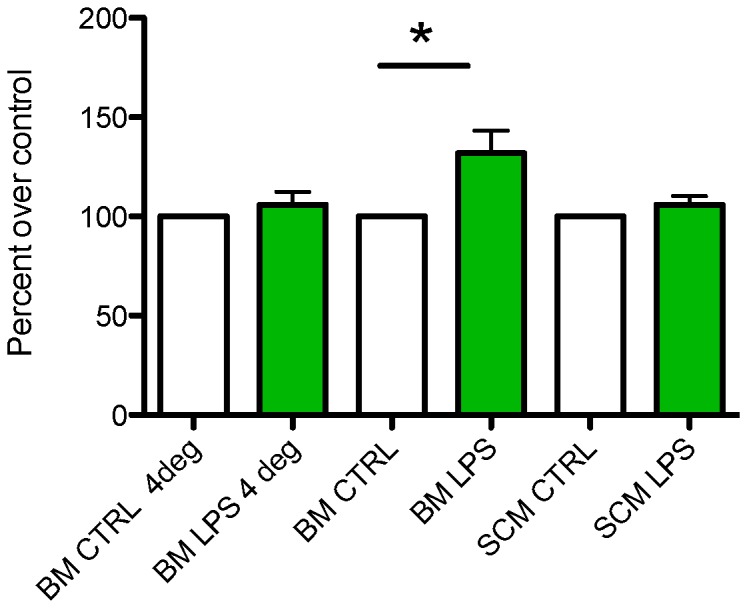
Microglia are the primary immune cells of the central nervous system (CNS). Membrane bound sensors on their processes monitor the extracellular environment and respond to perturbations of the CNS such as injury or infection. Once activated, microglia play a crucial role in determining neuronal survival. Recent studies suggest that microglial functional response properties vary across different regions of the CNS. However, the activation profiles of microglia derived from the spinal cord have not been evaluated against brain microglia in vitro. Here, we studied the morphological properties and secretion of inflammatory and trophic effectors by microglia derived from the brain or spinal cord of neonatal rats under basal culture conditions and after activation with lipopolysaccharide (LPS). Our results demonstrate that spinal microglia assume a less inflammatory phenotype after LPS activation, with reduced release of the inflammatory effectors tumor necrosis factor alpha, interleukin-1 beta, and nitric oxide, a less amoeboid morphology, and reduced phagocytosis relative to brain-derived microglia. Phenotypic differences between brain and spinal microglia are an important consideration when evaluating anti-inflammatory or immunomodulatory therapies for brain versus spinal injury.


Conflict of interest statement

Competing Interests: The authors have declared that no competing interests exist.

Figures

Figure 1
Figure 1. SCM isolation by mild trypsinization.
(A) Representative micrograph of Iba1 labeled microglia derived from BM or SCM. Scale  = 50 µm. (B) 20 minutes of mild trypsinization had the highest yield of SCM. SCM counts were quantified from average of 6 fields each from four wells of 12 well cell culture plate (n = 4 where n represent the number of independent experiments, where an independent experiment is a separate microglia preparation).
Figure 2
Figure 2. LPS mediated changes in morphology of SCM and BM.
BM and SCM were activated with LPS to compare the differences in ramified, amoeboid and spherical morphologies. (A) A main effect of treatment group (BM control, BM LPS, SCM control, or SCM LPS) on the proportion of microglia with ramified morphology was not significant (ANOVA, F(3,8) = 3.893, p = 0.0551). (B) A significant main effect of treatment on the percentage of amoeboid cells was found (ANOVA, F(3,8) = 14.32, p = 0.0014). Notably, LPS activated SCM had significant lower percentage of amoeboid cells relative to SCM controls and LPS activated BM (Newman-Keuls post hoc test, n = 3, p<0.05). (C) Treatment significantly altered the percentage of spherical cells (ANOVA, F(3,8) = 8.125, p = 0.00821). LPS activated BM and SCM had a significant increase in spherical morphology relative to control conditions (Newman-Keul post hoc test, n = 3, p<0.05). n represents the number of independent experiment with a minimum of three replicates. Bars represent percent morphology of cell ± s.e.m.
Figure 3
Figure 3. LPS mediated pro-inflammatory molecules release by SCM and BM.
BM and SCM were activated with LPS to measure the difference in their pro-inflammatory molecules release. (A) A significant effect of treatment on TNF-α secretion between groups was observed (ANOVA, F(3,16) = 5.201, p = 0.0107). LPS activated BM had significantly higher release of TNF-α compared to BM control and LPS activated SCM (Neuwman-Keuls post hoc test n = 5, p<0.05). SCM had a trend towards increase in TNF-α on activation with LPS. (B) A significant effect of treatment was also observed for IL-1β secretion (ANOVA, F(3,16) = 4.210, p = 0.0225). LPS BM had a significantly higher release of IL-1β compared to BM control and LPS activated SCM (Newman-Keul post hoc test n = 5, p<0.05). We did not see any change in IL-1β release between LPS activated SCM and SCM control (Newman-Keul post hoc, n = 5, p>0.05). (C) A significant main effect of treatment group on NO release was observed (ANOVA, F(3,24) = 15.76, p = 0.0001). LPS induced a significant increase in release of NO by BM compared to BM control and LPS activated SCM (Newman-Keul post hoc, n = 7, p<0.05). NO release by LPS activated SCM was significantly higher than that of SCM and BM controls (Newman-Keul post hoc, n = 7, p<0.05). However, NO release by LPS activated SCM was significantly less than that of LPS activated BM (Newman-Keul post hoc, n = 7, p<0.05). n represents the number of independent experiment with a minimum of three replicates. Bars represent cytokine or nitrite per milligram of total protein ± s.e.m.
Figure 4
Figure 4. Release of IL-6, IL-10, and BDNF by SCM and BM under basal conditions and after LPS activation.
BM and SCM were activated with LPS to measure the difference in their release of these cytokines and trophic factors. (A) There was no significant main effect of treatment group on IL-6 release (ANOVA, F(3,8) = 3.632, p = 0.0642, n = 3) on IL-6 release. LPS activated BM and SCM exhibited a trend towards increased in release of IL-6 compared to their respective controls. Similarly, a significant main effect of treatment was not observed for either IL-10 release (B, ANOVA, F(3,16) = 0.6086, p = 0.6190, n = 5) or BDNF release (C, ANOVA, F(3,8) = 0.1420, p = 0.9320, n = 3). n represents the number of independent experiment with a minimum of three replicates. Bars represent cytokine or trophic factor per milligram of total protein ± s.e.m.
Figure 5
Figure 5. LPS mediated phagocytosis in SCM and BM.
Phagocytosis was measured according to fluorescent intensity of cell lysate from control or LPS activation BM or SCM. Within each independent experiment, fluorescence was normalized to mean control values. LPS induced a significant increase in phagocytic activity of BM relative to control (n = 8, one sample t-test, p<0.05) but did not induce any change in the phagocytic activity of SCM (n = 3, one sample t-test, p>0.05). Phagocytic assays were performed at 4 degree Celsius as negative controls (i.e. a reduced phagocytosis condition) to confirm assay validity (n = 5). n represents the number of independent experiment with a minimum of three replicates.

References

    1. Giulian D, Baker TJ (1986) Characterization of ameboid microglia isolated from developing mammalian brain. The Journal of neuroscience: the official journal of the Society for Neuroscience 6: 2163–2178. - PMC - PubMed
    1. Rezaie P, Male D (1999) Colonisation of the developing human brain and spinal cord by microglia: a review. Microscopy research and technique 45: 359–382. - PubMed
    1. Aloisi F (2001) Immune function of microglia. Glia 36: 165–179. - PubMed
    1. Wake H, Moorhouse AJ, Jinno S, Kohsaka S, Nabekura J (2009) Resting microglia directly monitor the functional state of synapses in vivo and determine the fate of ischemic terminals. The Journal of neuroscience: the official journal of the Society for Neuroscience 29: 3974–3980. - PMC - PubMed
    1. Lai AY, Todd KG (2006) Hypoxia-activated microglial mediators of neuronal survival are differentially regulated by tetracyclines. Glia 53: 809–816. - PubMed

Publication types

LinkOut - more resources