. 2014 Jun 10;9(6):e99504.
doi: 10.1371/journal.pone.0099504. eCollection 2014.

In vitro analysis of human immunodeficiency virus particle dissociation: gag proteolytic processing influences dissociation kinetics

Affiliations

In vitro analysis of human immunodeficiency virus particle dissociation: gag proteolytic processing influences dissociation kinetics

Barbara Müller et al. PLoS One. .

Abstract

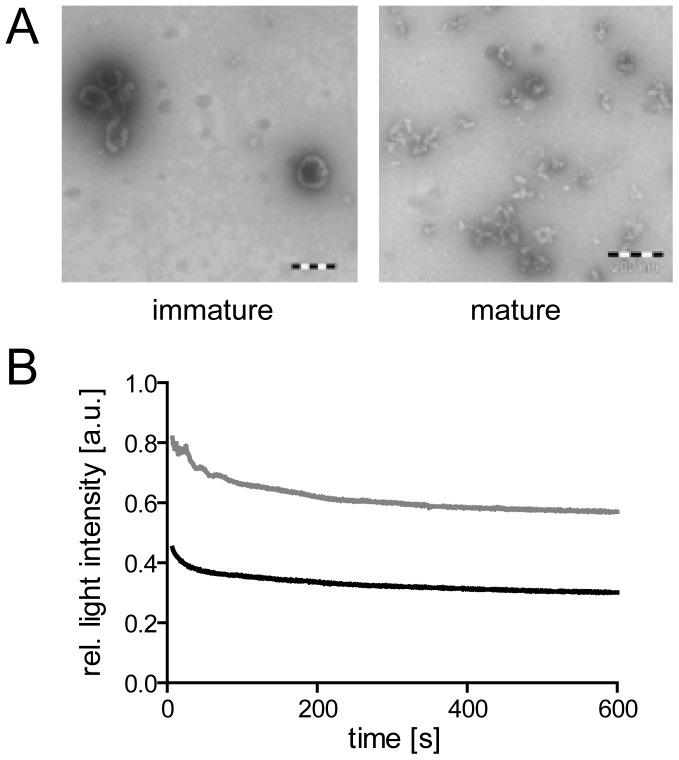
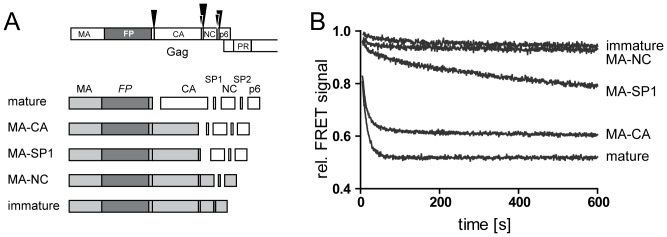
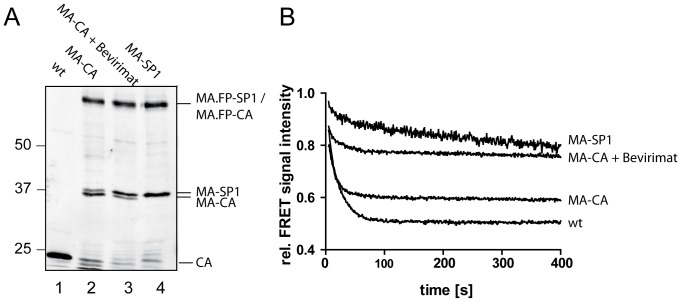
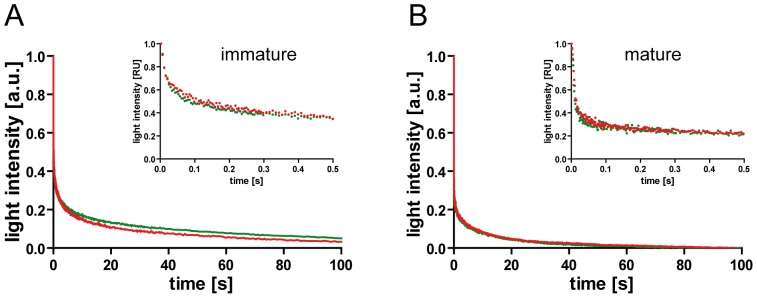
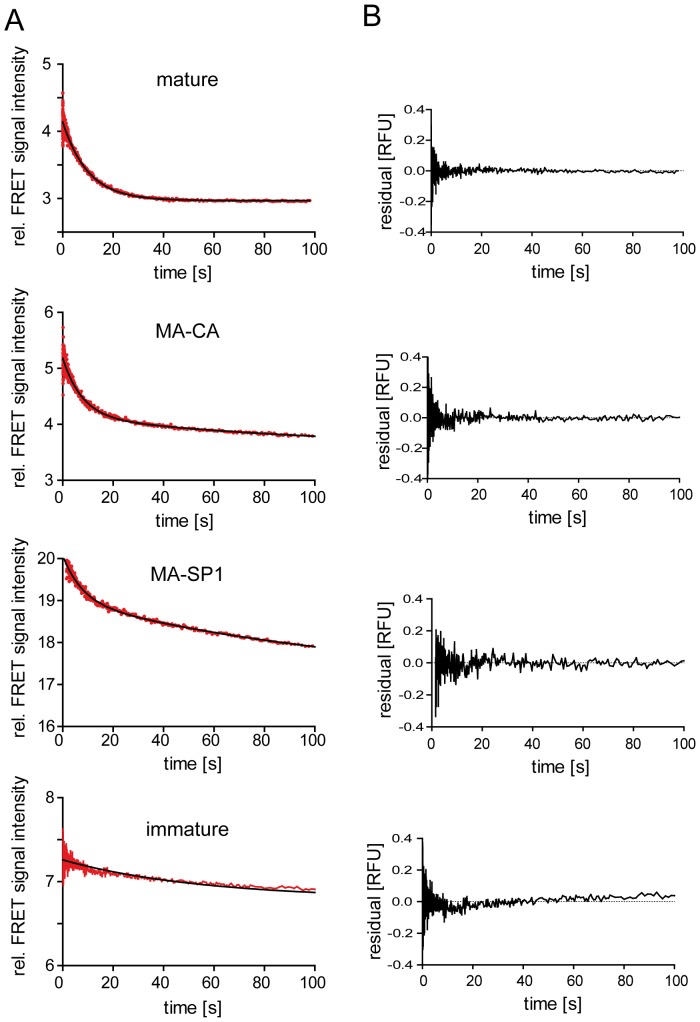
Human immunodeficiency virus particles undergo a step of proteolytic maturation, in which the main structural polyprotein Gag is cleaved into its mature subunits matrix (MA), capsid (CA), nucleocapsid (NC) and p6. Gag proteolytic processing is accompanied by a dramatic structural rearrangement within the virion, which is necessary for virus infectivity and has been proposed to proceed through a sequence of dissociation and reformation of the capsid lattice. Morphological maturation appears to be tightly regulated, with sequential cleavage events and two small spacer peptides within Gag playing important roles by regulating the disassembly of the immature capsid layer and formation of the mature capsid lattice. In order to measure the influence of individual Gag domains on lattice stability, we established Förster's resonance energy transfer (FRET) reporter virions and employed rapid kinetic FRET and light scatter measurements. This approach allowed us to measure dissociation properties of HIV-1 particles assembled in eukaryotic cells containing Gag proteins in different states of proteolytic processing. While the complex dissociation behavior of the particles prevented an assignment of kinetic rate constants to individual dissociation steps, our analyses revealed characteristic differences in the dissociation properties of the MA layer dependent on the presence of additional domains. The most striking effect observed here was a pronounced stabilization of the MA-CA layer mediated by the presence of the 14 amino acid long spacer peptide SP1 at the CA C-terminus, underlining the crucial role of this peptide for the resolution of the immature particle architecture.


Conflict of interest statement

Competing Interests: The authors have declared that no competing interests exist.

Figures

Figure 1
Figure 1. Effect of mild detergent treatment on virus particles.
(A) Electron microscopy analysis of particle structures. Immature or mature particles, respectively, prepared as described in materials and methods were adhered to formvar coated electron microscopy grids and treated for 10 min with 0.05% TX-100 in PBS. Detergent solution was removed and protein structures were visualized by negative staining according to standard procedures. Scale bars: 200 nm. (B) Decay of light scattering signal upon detergent mediated particle dissociation at 25°C. Light scatter intensities of immature (gray line) and mature (black line) HIV-1 particle suspensions in PBS were determined using an SLM AB2 spectrofluorometer at a wavelength of 436 nm. At t = 0, TX-100 was added to a final concentration of 0.05%. Data shown are normalized to scatter intensities measured before detergent addition; raw data are presented as part of Figure S1.
Figure 2
Figure 2. FRET based measurements of HIV particle dissociation.
(A) Schematic representation of the HIV-1 Gag protein, showing the position of the insertion of the FRET donor or acceptor fluorophore. Arrows indicate cleavage sites for the viral protease. (B) HIVeCFP/eYFP reporter particles carrying a mixture of untagged, donor- and acceptor-tagged Gag polyproteins. Detergent treatment of mature particles disrupts the lipid envelope of the virion, resulting in dissociation of the labeled MA layer and the viral core. (C) Emission spectra obtained for single labeled and dual labeled fluorescent HIV particles. Particles were purified from the tissue culture supernatant of 293T cells transfected with an equimolar mixture of pCHIV and pCHIVeCFP (HIVeCFP), pCHIV and pCHIVeYFP (HIVeYFP) or with pCHIV, pCHIVeCFP and pCHIVeYFP at a molar ratio 2∶1∶1, (HIVeCFP/eYFP), respectively. Purified particles were incubated in PBS at 25°C, excited at 433 nm and emission spectra were recorded (black lines).Subsequently, TX-100 was added to a final concentration of 0.05% to disrupt the viral envelope and emission spectra were again recorded after 15 min incubation (gray lines). (D) Time dependence of FRET intensity changes upon disruption of the lipid envelope. Mature (black line) or immature (gray line) HIVeCFP/eYFP particles were incubated in PBS at 25°C and fluorescence intensity was recorded at 433 nm/528 nm. At t = 0 s, 0.05% TX-100 was added and incubation was continued. At t = 500 s (arrows), purified HIV-1 PR was added and incubation was continued. Intensity values shown are normalized to the intensity measured before detergent addition.
Figure 3
Figure 3. Dissociation kinetics of partially processed Gag derivatives.
HIVeCFP/eYFP particles containing partially processed Gag derivatives were generated by co-transfection of pCHIV, pCHIVeCFP and pCHIVeYFP derivatives carrying the respective mutations at individual PR processing sites in Gag. (A) Top, domains of the FP labeled HIV-1 Gag protein. Arrowheads indicate cleavage sites for the viral PR with the size of the arrowheads representing relative rates of cleavage (not drawn to scale). Bottom, scheme of the panel of cleavage site mutants used here. Light gray boxes represent the uncleaved Gag derived proteins comprising the FP domain (dark gray). (B) FRET reporter particles representing the PR cleavage site variants displayed in (A) were purified from the tissue culture supernatant of 293T cells transfected with the respective plasmid mixtures. Particles were incubated in PBS at 25°C and fluorescence emission at 528 nm was monitored (excitation: 433 nm). TX-100 (0.05%) was added at t = 0 s and incubation was continued. Intensity values shown are normalized to fluorescence intensity measured before detergent addition. Data shown are representative for measurements performed with at least four independent virus preparations.
Figure 4
Figure 4. Dependence of dissociation kinetics on the relative degree of SP1 cleavage from MA-CA.
(A) Immunoblot analysis of particles. FRET reporter particles were purified from the tissue culture supernatant of 293T cells transfected with plasmid mixtures consisting of FP-labeled and unlabeled variants of pCHIV (wt), pCHIV(MA-CA), pCHIV(MA-CA) transfected in the presence of bevirimat and pCHIV(MA-SP1), respectively. Samples of purified particles were separated by SDS-PAGE and Geg derived proteins were detected by quantitative immunoblot (LiCor Odyssey) using polyclonal rabbit antiserum raised against HIV-1 CA. Positions of molecular mass standards are indicated to the left (in kDa). (B) FRET measurements. The indicated particles were incubated in PBS at 25°C and fluorescence emission at 528 nm was monitored (excitation: 433 nm). At t = 0 s, 0.05% TX-100 was added and incubation was continued. Intensity values shown are normalized to fluorescence intensity measured before detergent addition.
Figure 5.Comparison
Figure 5.Comparison. of HIVeCFP/eYFP with unlabeled HIV-1 particles by light scatter analysis.
Static light scatter intensities of HIV (red) or HIVeCFP/eYFP (green) particle preparations were analyzed by stopped-flow measurement in PBS/0.05% TX-100. Graphs show data obtained for immature (A) and mature (B) particles, respectively. For a direct comparison of curves, data were normalized for the amplitude of the respective data set (1 =  initial value, 0 =  plateau reached at 300 s). Curves shown represent averaged data from 5–6 individual measurements. Main graphs show the first 100 s of the dissociation reaction, smaller insets display enlargements of the initial phases (500 ms). Data shown are representative for measurements performed with at least two independent virus preparations.
Figure 6
Figure 6. Stopped-flow FRET measurements.
(A) The indicated HIVeCFP/eYFP reporter particles were purified from the supernatant of transfected 293T cells and suspended in PBS. Dissociation in the presence of 0.05% TX-100 was monitored by FRET analysis using a stopped-flow setup as described in materials and methods. FRET signal intensities averaged from six individual measurements each are plotted in red; black lines indicate single (mature, immature) or double (MA-CA, MA-SP1) exponential fits to the data, yielding the kinetic constants summarized in Table 1. (B) Residual plots derived from the data shown in (A) are represented besides the respective graphs.

References

    1. Briggs JA, Kräusslich HG (2011) The molecular architecture of HIV. J Mol Biol 410: 491–500. - PubMed
    1. Sundquist WI, Krausslich HG (2012) HIV-1 Assembly, Budding, and Maturation. Cold Spring Harb Perspect Med 2.. - PMC - PubMed
    1. Helenius A (1992) Unpacking the incoming influenza virus. Cell 69: 577–578. - PubMed
    1. Park J, Morrow CD (1993) Mutations in the protease gene of human immunodeficiency virus type 1 affect release and stability of virus particles. Virology 194: 843–850. - PubMed
    1. Reicin AS, Paik S, Berkowitz RD, Luban J, Lowy I, et al. (1995) Linker insertion mutations in the human immunodeficiency virus type 1 gag gene: effects on virion particle assembly, release, and infectivity. J Virol 69: 642–650. - PMC - PubMed

Publication types

Substances