. 2014 Jul:139:22-30.
doi: 10.1016/j.mad.2014.06.003. Epub 2014 Jun 7.

Similar patterns of clonally expanded somatic mtDNA mutations in the colon of heterozygous mtDNA mutator mice and ageing humans

Affiliations

Similar patterns of clonally expanded somatic mtDNA mutations in the colon of heterozygous mtDNA mutator mice and ageing humans

Holly L Baines et al. Mech Ageing Dev. 2014 Jul.

Abstract

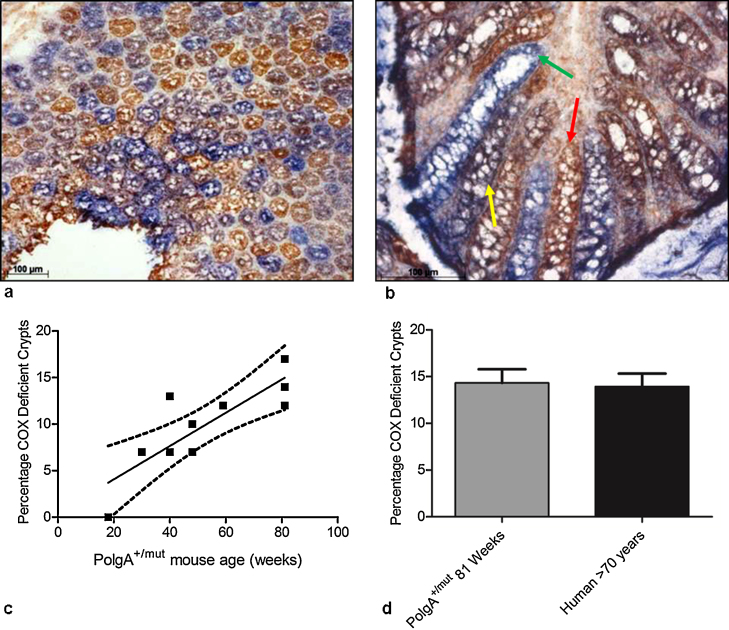
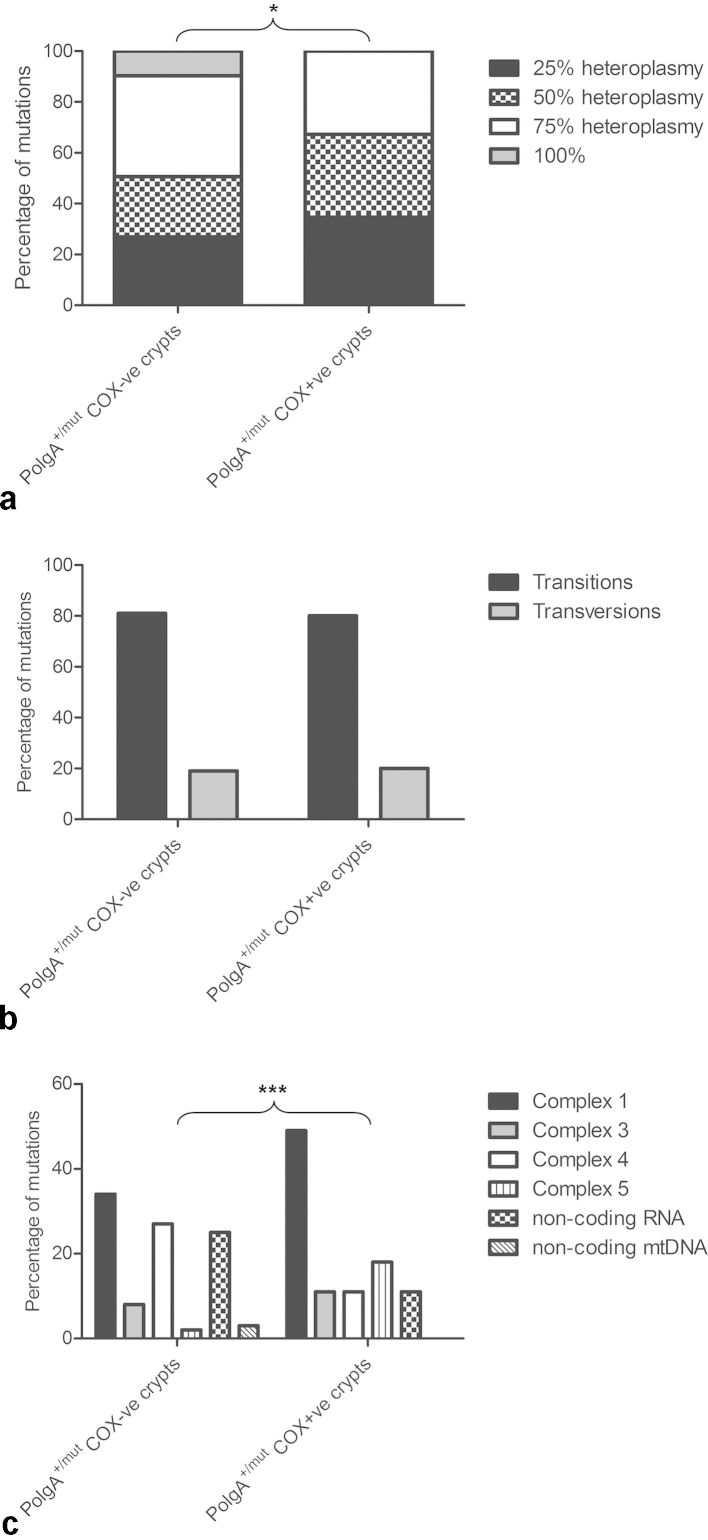
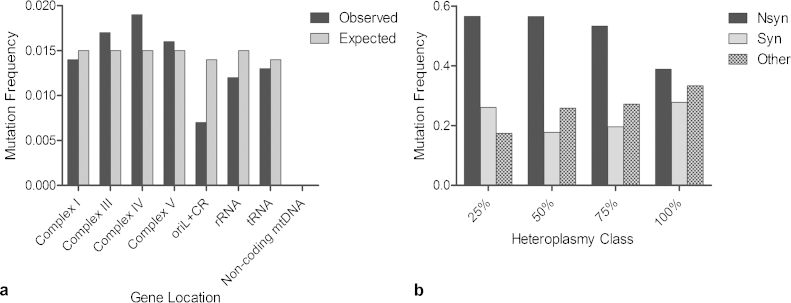
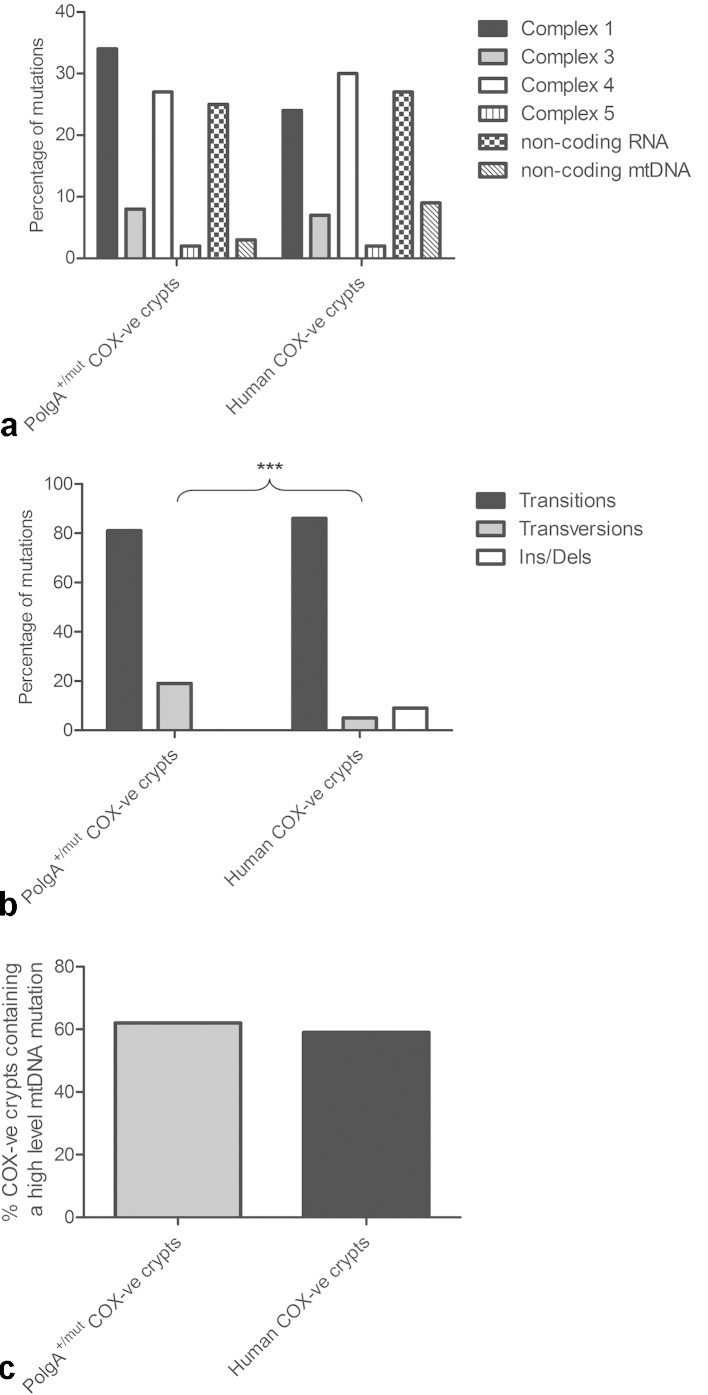
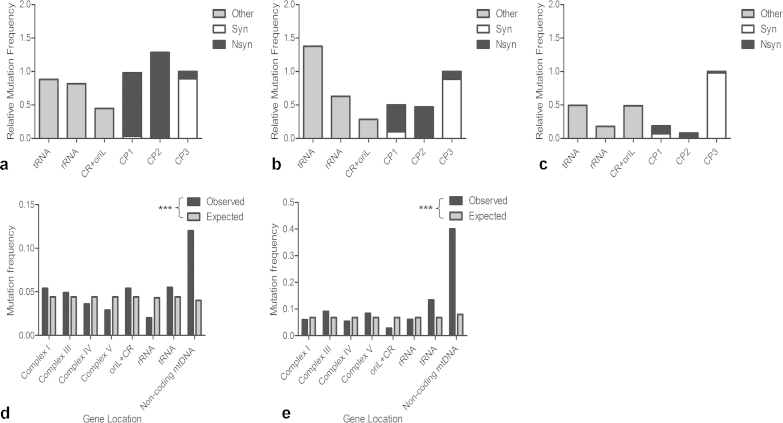
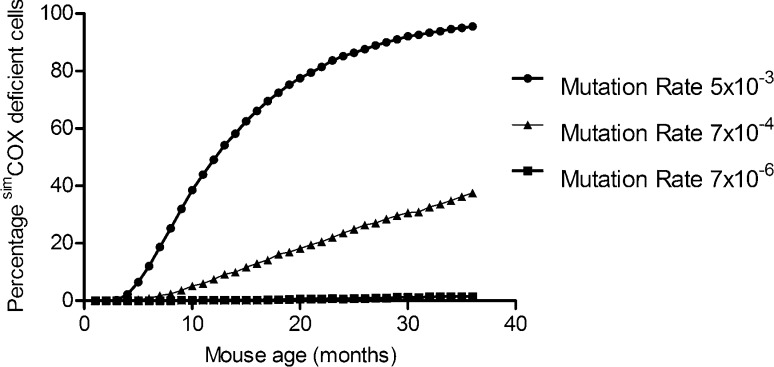
Clonally expanded mitochondrial DNA (mtDNA) mutations resulting in focal respiratory chain deficiency in individual cells are proposed to contribute to the ageing of human tissues that depend on adult stem cells for self-renewal; however, the consequences of these mutations remain unclear. A good animal model is required to investigate this further; but it is unknown whether mechanisms for clonal expansion of mtDNA mutations, and the mutational spectra, are similar between species. Here we show that mice, heterozygous for a mutation disrupting the proof-reading activity of mtDNA polymerase (PolgA(+/mut)) resulting in an increased mtDNA mutation rate, accumulate clonally expanded mtDNA point mutations in their colonic crypts with age. This results in focal respiratory chain deficiency, and by 81 weeks of age these animals exhibit a similar level and pattern of respiratory chain deficiency to 70-year-old human subjects. Furthermore, like in humans, the mtDNA mutation spectrum appears random and there is an absence of selective constraints. Computer simulations show that a random genetic drift model of mtDNA clonal expansion can accurately model the data from the colonic crypts of wild-type, PolgA(+/mut) animals, and humans, providing evidence for a similar mechanism for clonal expansion of mtDNA point mutations between these mice and humans.

Keywords: Ageing; Colon; Mitochondria; Mouse; MtDNA.


Figures

Fig. 1
Fig. 1
Respiratory chain deficiency in the ageing PolgA+/mut mouse colon. (a) COX/SDH histochemistry on 81 week old PolgA+/mut mouse colon, showing a transverse section through the crypts. (b) COX/SDH histochemistry on 81 week old PolgA+/mut mouse colon, showing a longitudinal section through the crypts. Scale bars: 100 μm. Crypts stained brown are positive for COX activity (red arrow), those stained blue are COX deficient (green arrow), and crypts stained purple/grey display intermediate COX deficiency (yellow arrow). Note that in the COX deficient crypt (green arrow) the COX deficiency extends throughout the crypt, including the stem cell compartment. (c) Incidence of COX deficient colonic crypts in PolgA+/mut mice aged 18–81 weeks old. Linear regression analysis, p = 0.0028. (d) Mean incidence (±SEM) of COX deficient colonic crypts in 81 week old PolgA+/mut mice and aged humans >70 years old (Taylor et al., 2003). The percentage of COX deficient colonic crypts was not significantly different between 81 week PolgA+/mut mice and aged humans >70 years old, p = 0.854 (unpaired t test).
Fig. 2
Fig. 2
Frequency, type and location of somatic mtDNA point mutations in PolgA+/mut mouse colonic crypts. (a) The frequency of mutations across the different heteroplasmy classes in PolgA+/mut mouse COX deficient and COX positive colonic crypts. There was a significantly high frequency of mtDNA mutations in the higher heteroplasmy classes in the COX deficient crypts (χ2 analysis p = 0.0439). (b) Types of changes observed in COX deficient and COX positive colonic crypts. There was no significant difference in the types of changes between the two (χ2 test p = 1.000). (c) Gene location of mutations in individual mtDNA encoded genes in COX deficient and positive colonic crypts. There was a significant difference between the location of the mtDNA mutations detected in COX positive and COX deficient crypts (χ2 test p = <0.0001).
Fig. 3
Fig. 3
MtDNA mutations occur randomly in PolgA+/mut mouse colonic crypts. (a) Positional mutation frequency of observed vs expected (number of mutations/base pairs) somatic mtDNA mutations in the different gene types detected in PolgA+/mut colonic crypts. There was no significant difference between the observed and expected frequencies, (p = 0.139, χ2 test). Abbreviations: oriL, origin of light strand replication; CR, control region. (b) The mutation frequency of non-synonymous, synonymous and “other” changes across the different heteroplasmy classes in the PolgA+/mut mouse colonic crypts. There was no significant difference in the types of mutations observed between the heteroplasmy classes (χ2 analysis, p = 0.6765) Abbreviations: Nsyn, non-synonymous and syn, synonymous changes.
Fig. 4
Fig. 4
Gene type, location and clonal expansion of somatic mtDNA point mutations in the ageing PolgA+/mut mouse and human colon. (a) Gene location of mutations in individual mtDNA encoded genes in COX deficient colonic crypts. There was no significant difference between the PolgA+/mut mouse crypts and the human crypts (χ2 test p = 0.2204). (b) Types of changes observed in COX deficient colonic crypts. There was a significantly higher frequency of insertion/deletion mutations in the human crypts (χ2 test p = <0.001). (c) Percentage of COX deficient colonic crypts containing at least one pathogenic mtDNA point mutation in the PolgA+/mut mouse and human colon. There was no significant difference between the mouse and human crypts (χ2 test p = 0.8194).
Fig. 5
Fig. 5
Genetic consequences of somatic mtDNA mutations in the PolgA+/mut mouse colon. The ratio of non-synonymous mutations: synonymous mutations in PolgA+/mut mouse colonic crypts, the mtDNA mutator mouse germline and normal mouse strains. The ratio of non-synonymous to synonymous mutations is significantly higher in PolgA+/mut mouse colonic crypts compared to both the mtDNA mutator mouse germline and the normal mouse strains (p = <0.0001, Fisher's exact test).
Fig. 6
Fig. 6
Positional mutation frequency and mutation distribution by codon position and gene reveals an absence of evidence for purifying selection on somatic mtDNA point mutations in PolgA+/mut colonic crypts. (a) Positional mutation frequency (observed mutations per base pair) of somatic mtDNA mutations observed in PolgA+/mut colonic crypts compared to (b) mtDNA mutations transmitted through the mtDNA mutator mouse germline (Stewart et al., 2008b) and (c) mtDNA sequences of mouse strains from Genback, Mus musculus. To compare between the classes we took the sum of the 3rd codon position and standardised that as 1 (value/3rd codon sum). CP1-3: codon positions 1–3. (d) Positional mutation frequency (number of mutations/base pairs) of observed vs expected (based on a random distribution) mtDNA point mutations transmitted through the mtDNA mutator mouse germline (Stewart et al., 2008b) (p = <0.0001, χ2 test) and (e) mtDNA sequences of mouse strains from Genbank, Mus musculus (p = <0.0001, χ2 test).
Fig. 7
Fig. 7
In silico modelling of the clonal expansion of mitochondrial DNA mutations in colonic crypt stem cells. Each symbol is the mean of 1000 simulated cells, each containing 200 mtDNA molecules with the mutation rates described, with a cell division rate of once per day for 3 years. To match the experimentally observed COX deficiency data from WT (Greaves et al., 2011), PolgA+/mut (Fig. 1) and PolgAmut/mut mice (Supplementary File 4), we performed a parameter scan of the mtDNA mutation rate, assuming >75% mutated mtDNA was enough to confer COX deficiency. The mtDNA mutation frequency was determined by averaging of 1000 simulation runs of 1080 divisions (36 months). The proportion of simulated cells containing >75% mutant mtDNA (simCOXdeficient cells) predicted by the model at the three mutation rates shown, closely matches our experimental data from wild-type, PolgA+/mut, and PolgAmut/mut mice.

Similar articles

Cited by

References

    1. Anderson S., Bankier A.T., Barrell B.G., de Bruijn M.H., Coulson A.R., Drouin J., Eperon I.C., Nierlich D.P., Roe B.A., Sanger F., Schreier P.H., Smith A.J., Staden R., Young I.G. Sequence and organization of the human mitochondrial genome. Nature. 1981;290:457–465. - PubMed
    1. Barker N., van Es J.H., Kuipers J., Kujala P., van den Born M., Cozijnsen M., Haegebarth A., Korving J., Begthel H., Peters P.J., Clevers H. Identification of stem cells in small intestine and colon by marker gene Lgr5. Nature. 2007;449:1003–1007. - PubMed
    1. Bratic A., Larsson N.G. The role of mitochondria in aging. J. Clin. Invest. 2013;123:951–957. - PMC - PubMed
    1. Coller H.A., Khrapko K., Bodyak N.D., Nekhaeva E., Herrero-Jimenez P., Thilly W.G. High frequency of homoplasmic mitochondrial DNA mutations in human tumors can be explained without selection. Nat. Genet. 2001;28:147–150. - PubMed
    1. Coller H.A., Khrapko K., Herrero-Jimenez P., Vatland J.A., Li-Sucholeiki X.C., Thilly W.G. Clustering of mutant mitochondrial DNA copies suggests stem cells are common in human bronchial epithelium. Mutat. Res. 2005;578:256–271. - PubMed

Publication types

LinkOut - more resources