. 2014 Jun 10;9(6):e98415.
doi: 10.1371/journal.pone.0098415. eCollection 2014.

Expression of PD-L1 on canine tumor cells and enhancement of IFN-γ production from tumor-infiltrating cells by PD-L1 blockade

Affiliations

Expression of PD-L1 on canine tumor cells and enhancement of IFN-γ production from tumor-infiltrating cells by PD-L1 blockade

Naoya Maekawa et al. PLoS One. .

Abstract

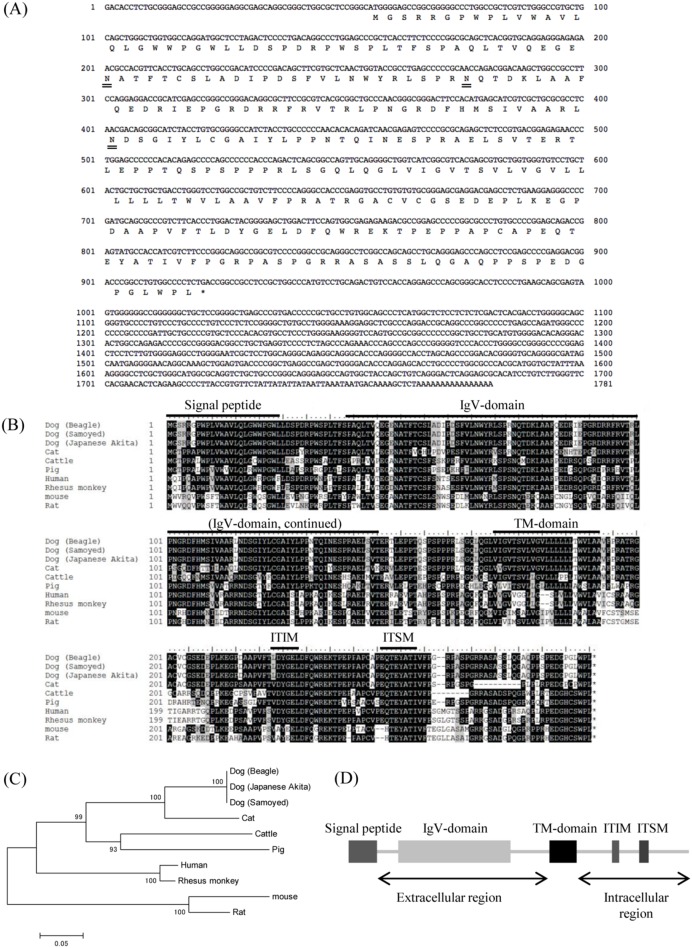
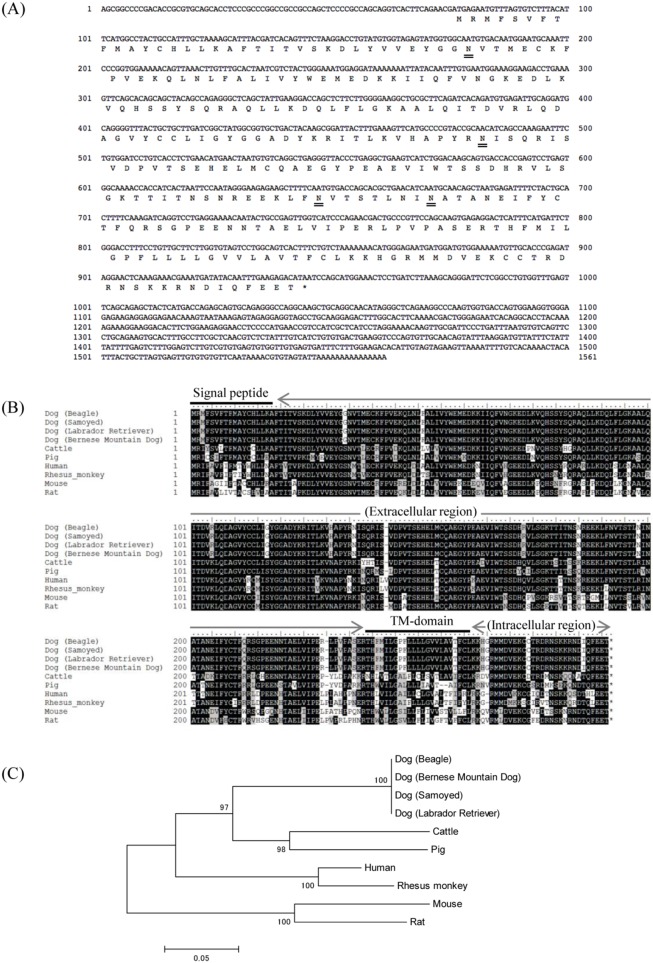
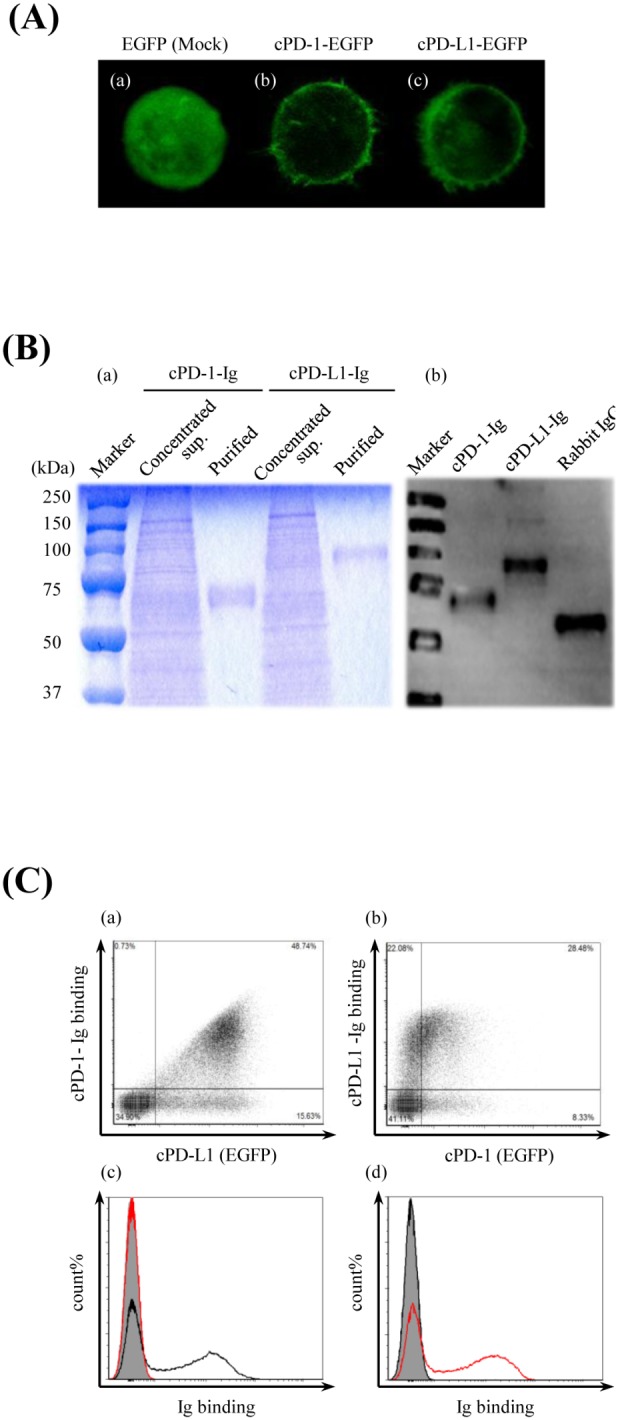
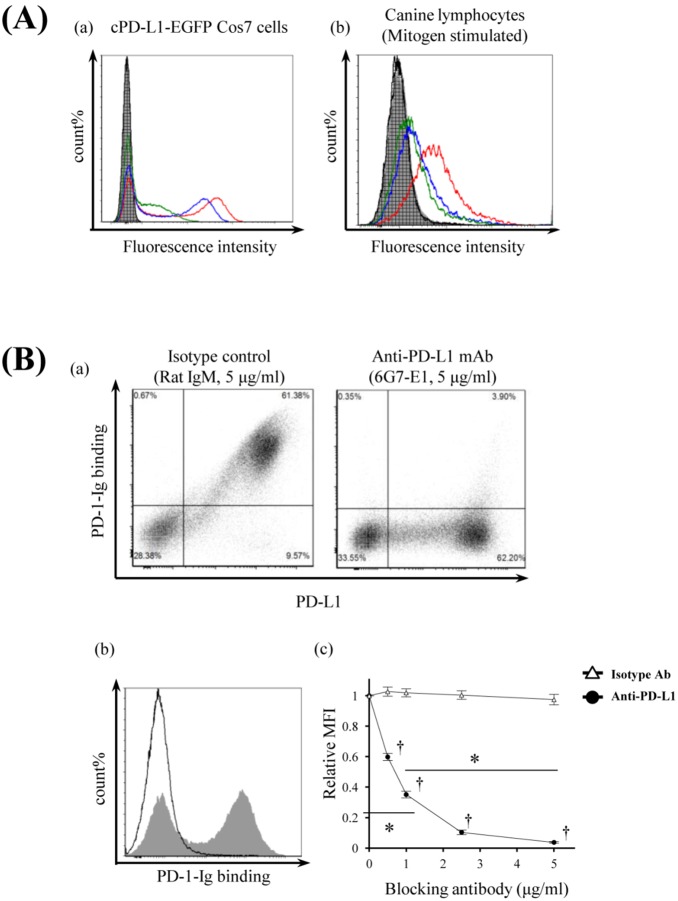
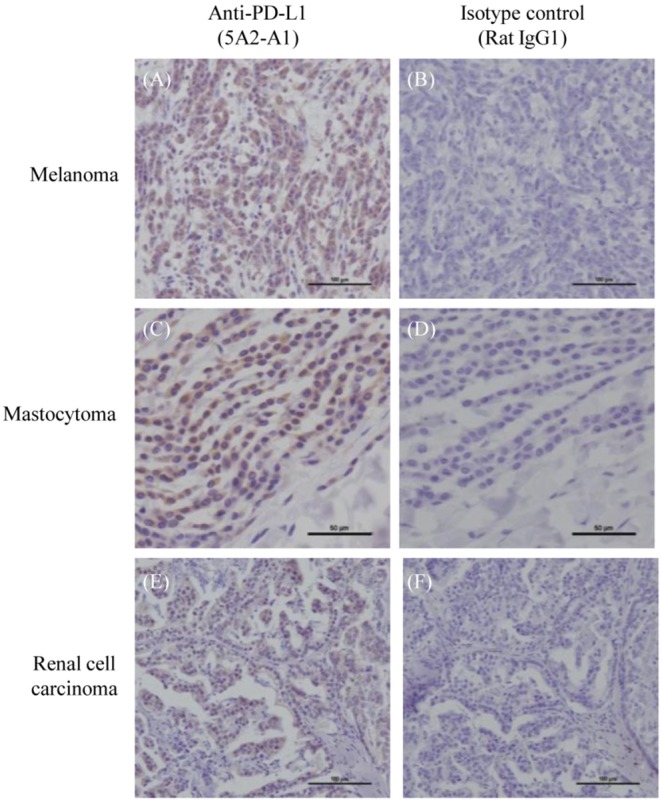
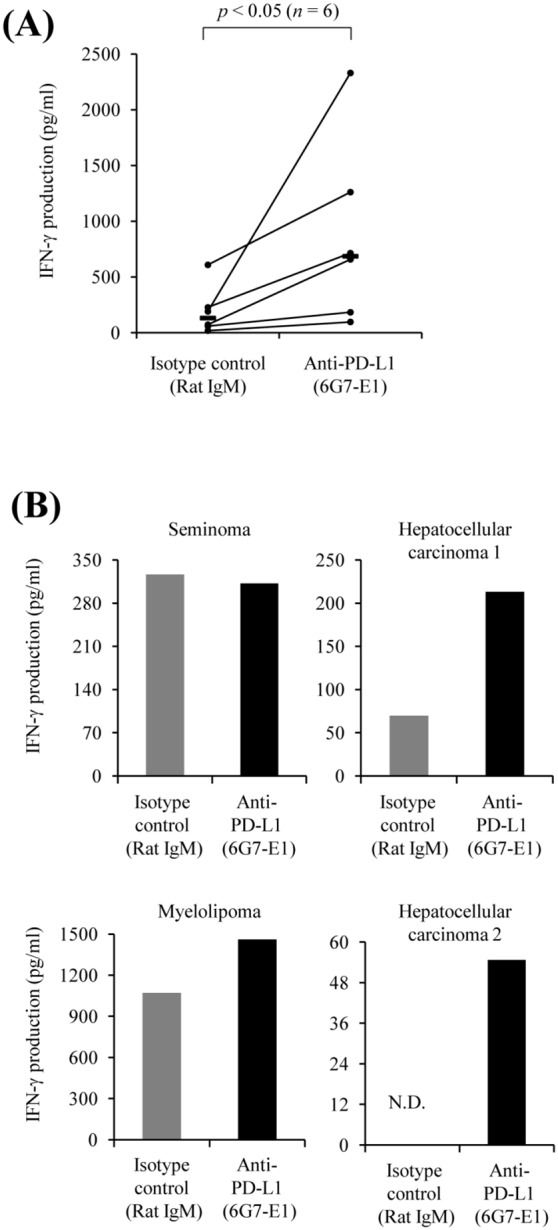
Programmed death 1 (PD-1), an immunoinhibitory receptor, and programmed death ligand 1 (PD-L1), its ligand, together induce the "exhausted" status in antigen-specific lymphocytes and are thus involved in the immune evasion of tumor cells. In this study, canine PD-1 and PD-L1 were molecularly characterized, and their potential as therapeutic targets for canine tumors was discussed. The canine PD-1 and PD-L1 genes were conserved among canine breeds. Based on the sequence information obtained, the recombinant canine PD-1 and PD-L1 proteins were constructed; they were confirmed to bind each other. Antibovine PD-L1 monoclonal antibody effectively blocked the binding of recombinant PD-1 with PD-L1-expressing cells in a dose-dependent manner. Canine melanoma, mastocytoma, renal cell carcinoma, and other types of tumors examined expressed PD-L1, whereas some did not. Interestingly, anti-PD-L1 antibody treatment enhanced IFN-γ production from tumor-infiltrating cells. These results showed that the canine PD-1/PD-L1 pathway is also associated with T-cell exhaustion in canine tumors and that its blockade with antibody could be a new therapeutic strategy for canine tumors. Further investigations are needed to confirm the ability of anti-PD-L1 antibody to reactivate canine antitumor immunity in vivo, and its therapeutic potential has to be further discussed.


Conflict of interest statement

Competing Interests: The authors have declared that no competing interests exist.

Figures

Figure 1
Figure 1. Sequence analysis of canine PD-1.
(A) Nucleic acid and deduced amino acid sequences of canine PD-1 cDNA. Canine PD-1 cDNA encodes for a 288 amino acid polypeptide. Predicted N-glycosylation sites in the amino acid sequence of canine PD-1 are doubly underlined. (B) Multiple sequence alignment of vertebrate PD-1 amino acid sequences. Predicted domains and motifs of canine PD-1 are shown in the figure. Signal peptide, 1–24; IgV domain, 39–145; transmembrane domain, 170–192; ITIM, 223–228; ITSM, 246–253. (C) Phylogenetic tree of the canine PD-1 sequence in relation to those of other vertebrate species. The bootstrap consensus tree was inferred from 1000 replicates (the numbers next to the branches indicate the bootstrap percentage). The scale indicates the divergence time. (D) Schematic image of predicted functional motifs in canine PD-1. Canine PD-1 consists of an extracellular region, a transmembrane region, and an intracellular region.
Figure 2
Figure 2. Sequence analysis of canine PD-L1.
(A) Nucleic acid and deduced amino acid sequences of canine PD-L1 cDNA. Canine PD-L1 cDNA encodes for a 289 amino acid polypeptide. Predicted N-glycosylation sites in the amino acid sequence of canine PD-L1 are doubly underlined. (B) Multiple sequence alignment of vertebrate PD-L1 amino acid sequences. Predicted domains and regions of canine PD-L1 are shown in the figure. Signal peptide, 1–18; transmembrane domain, 237–259. Canine PD-L1 consists of an extracellular region, a transmembrane region, and an intracellular region. (C) Phylogenetic tree of the canine PD-L1 sequence in relation to those of other vertebrate species. The bootstrap consensus tree was inferred from 1000 replicates (the numbers next to the branches indicate the bootstrap percentage). The scale indicates the divergence time.
Figure 3
Figure 3. Establishment of canine PD-1– or PD-L1– expressing cells and Ig fusion recombinant proteins.
(A) Canine PD-1–EGFP– or canine PD-L1–EGFP–expressing cell. The subcellular distributions of EGFP only, cPD-1–EGFP, and cPD-L1–EGFP in transiently transfected Cos7 cells were analyzed by a confocal microscope (400×). Cos7 cells were transfected with (a) pEGFP-N2 vector only (Mock), (b) pEGFP-N2–cPD-1 or (c) pEGFP-N2–cPD-L1. (B) Production and purification of Ig fusion recombinant proteins. The canine PD-1 and canine PD-L1 extracellular regions combined to the rabbit IgG Fc region (cPD-1–Ig, cPD-L1–Ig) were expressed as soluble proteins in the culture supernatant by stably expressing CHO-DG44 cells, which had been transfected with pCXN2.1–rabbit IgG Fc-cPD-1 or pCXN2.1–rabbit IgG Fc-cPD-L1. (a) SDS–PAGE analysis of the concentrated culture supernatant of the expressing cells and the purified Ig fusion proteins. (b) Western blot analysis of the purified Ig fusion proteins. Rabbit IgG was used as a positive control. (C) Canine PD-L1 binds to canine PD-1. Transiently transfected cPD-1–EGFP– or cPD-L1–EGFP–expressing Cos7 cells were incubated with cPD-L1–Ig or cPD-1–Ig, respectively. The cells were washed and the binding of the Ig fusion proteins was analyzed by flow cytometry using a fluorescent labeled anti-rabbit IgG Fc antibody. cPD-1–EGFP or cPD-L1–EGFP expression on the transfected Cos7 cells were confirmed by EGFP fluorescence. (a) Binding of cPD-1–Ig to cPD-L1–expressing cells. (b) Binding of cPD-L1–Ig to cPD-1–expressing cells. (c) Histogram analysis of cPD-1–Ig binding to cPD-L1–EGFP–expressing cells. Black line, cPD-1–Ig; red line, cPD-L1–Ig; shaded area, rabbit IgG. (d) Histogram analysis of cPD-L1–Ig binding to cPD-1–EGFP–expressing cells. Black line, cPD-1–Ig; red line, cPD-L1–Ig; shaded area, rabbit IgG.
Figure 4
Figure 4. Monoclonal antibodies which recognize canine PD-L1.
(A) Cross-reactivities of antibovine PD-L1 monoclonal antibodies. Binding abilities of recently established anti-boPD-L1 monoclonal antibodies to canine PD-L1 were examined by flow cytometry. Three anti-boPD-L1 monoclonal antibody clones, 4G12-C1 (rat IgG2a), 5A2-A1 (rat IgG1), and 6G7-E1 (rat IgM), were tested and all the three clones were found to recognize canine PD-L1. Rat IgG2a, rat IgG1, and rat IgM were used as isotype-matched negative controls. (a) cPD-L1–EGFP–expressing Cos7 cells and (b) dog PBMCs stimulated with PMA/ionomysin for 3 days were stained with anti-boPD-L1 monoclonal antibodies (10 µg/mL) or isotype-matched control antibodies. Red line, 4G12-C1; blue line, 5A2-A1; green line, 6G7-E1; shaded area, rat IgG2a; vertical-striped area, rat IgG1; horizontal-striped area, rat IgM. (B) Blockade of cPD-1/cPD-L1 binding by anti-PD-L1 monoclonal antibody 6G7-E1. cPD-L1–EGFP–expressing cells were preincubated with anti-PD-L1 antibody and then cPD-1–Ig bindings were evaluated by flow cytometry. (a) Blocking effect of anti-PD-L1 monoclonal antibody 6G7-E1 on cPD-1/cPD-L1 binding. Five microgram per milliliter of isotype-matched control antibody (rat IgM) could not affect the cPD-1/cPD-L1 binding (left panel), whereas the same concentration of 6G7-E1 significantly blocked the Ig binding (right panel). (b) Representative histogram of the flow cytometric analysis. Shaded area, isotype control (5 µg/mL); solid line, anti-PD-L1 monocolonal antibody 6G7-E1 (5 µg/mL). (c) Dose-dependent blocking effect of 6G7-E1 on cPD-1/cPD-L1 binding. Cells were preincubated with 6G7-E1 or isotype control antibody at various concentrations (0.5, 1.0, 2.5, 5.0 µg/mL) and Ig binding was analyzed by flow cytometry. Each point indicates the average value of relative MFI obtained from three independent experiments (compared to no antibody control, error bar; SEM). Statistical significance was evaluated by Tukey’s test (*p<0.05, between the 0 µg/mL and the 1 µg/mL of anti-PD-L1 antibody treatment group and between the 1 µg/mL and the 5 µg/mL of anti-PD-L1 group. †p<0.05, between the each concentration of anti-PD-L1 group and the same concentration of isotype control group).
Figure 5
Figure 5. Expression of PD-L1 on dog tumor cells.
(A) Representative data for the analysis of PD-L1 expression on dog tumor cell lines (Table 3). Cells maintained in the medium or those stimulated by IFN-γ (100 ng/mL) for 24 h were stained with anti-PD-L1 monoclonal antibody 4G12-C1 or isotype control antibody (rat IgG2a). Black line, medium/4G12-C1; red line, IFN-γ/4G12-C1; shaded area, medium/isotype control; vertical-striped area, IFN-γ/isotype control. (B) Tumor tissues excised surgically from clinical cases of dog tumors were treated with collagenase, and a tumor single cell suspension was obtained. To reduce the effect of collagenase on the degradation of PD-L1 and to restore the cell surface PD-L1, the tumor cells were cultured in the medium for 24 h before FACS analysis. Lymphocytes obtained from healthy dogs were used as a negative control to confirm that the collagenase and culture treatment would not upregulate the PD-L1 expression. The histogram shows the expression of PD-L1 on each tumor cell. Solid line, 4G12-C1; shaded area, isotype control. AS, angiosarcoma; HCC, hepatocellular carcinoma; SC, squamous carcinoma; and BA, breast adenocarcinoma. Details of each tumor samples are shown in Table 4.
Figure 6
Figure 6. PD-L1 expression on dog tumor tissues.
Immunohistochemical analysis was performed using anti-PD-L1 monoclonal antibody 5A2-A1 or isotype control antibody (rat IgG1). (A–B) Representative immunohistochemical staining of melanoma. (C–D) Representative immunohistochemical staining of mastocytoma. (E–F) Representative immunohistochemical staining of renal cell carcinoma.
Figure 7
Figure 7. Effects of PD-L1 blockade by anti-PD-L1 monoclonal antibody.
(A) Effect of anti-PD-L1 monoclonal antibody on IFN-γ production of dog PBMCs. PBMCs obtained from healthy dogs were cultured with anti-PD-L1 monoclonal antibody 6G7-E1 or isotype-matched control antibodies (20 µg/mL) for 2 days. The concentration of IFN-γ in the culture supernatant was measured by ELISA. Statistical significance was evaluated by the Wilcoxon signed rank-sum test (n = 6, p<0.05). (B) Effect of blockade of the PD-1/PD-L1 pathway on IFN-γ production of tumor-infiltrating lymphocytes. Tumor-infiltrating lymphocytes were obtained from several dog tumor tissues and cultured with 20 µg/mL of anti-PD-L1 monoclonal antibody 6G7-E1 or isotype-matched control antibody for 2 days. Details of each tumor sample are shown in Table 6. N.D., Not Detected.

References

    1. Adams VJ, Evans KM, Sampson J, Wood JL (2010) Methods and mortality results of a health survey of purebred dogs in the UK. J Small Anim Pract 51: 512–524. - PubMed
    1. Dong H, Strome SE, Salomao DR, Tamura H, Hirano F, et al. (2002) Tumor-associated B7-H1 promotes T-cell apoptosis: a potential mechanism of immune evasion. Nat Med 8: 793–800. - PubMed
    1. Sznol M, Chen L (2013) Antagonist antibodies to PD-1 and B7-H1 (PD-L1) in the treatment of advanced human cancer. Clin Cancer Res 19: 1021–1034. - PMC - PubMed
    1. Ghebeh H, Mohammed S, Al-Omair A, Qattan A, Lehe C, et al. (2006) The B7-H1 (PD-L1) T lymphocyte-inhibitory molecule is expressed in breast cancer patients with infiltrating ductal carcinoma: correlation with important high-risk prognostic factors. Neoplasia 8: 190–198. - PMC - PubMed
    1. Geng L, Huang D, Liu J, Qian Y, Deng J, et al. (2008) B7-H1 up-regulated expression in human pancreatic carcinoma tissue associates with tumor progression. J Cancer Res Clin Oncol 134: 1021–1027. - PubMed

Publication types

MeSH terms

Substances