. 2014 Jun 10:3:e02678.
doi: 10.7554/eLife.02678.

Mechanisms of organelle biogenesis govern stochastic fluctuations in organelle abundance

Affiliations

Mechanisms of organelle biogenesis govern stochastic fluctuations in organelle abundance

Shankar Mukherji et al. Elife. .

Erratum in

Abstract

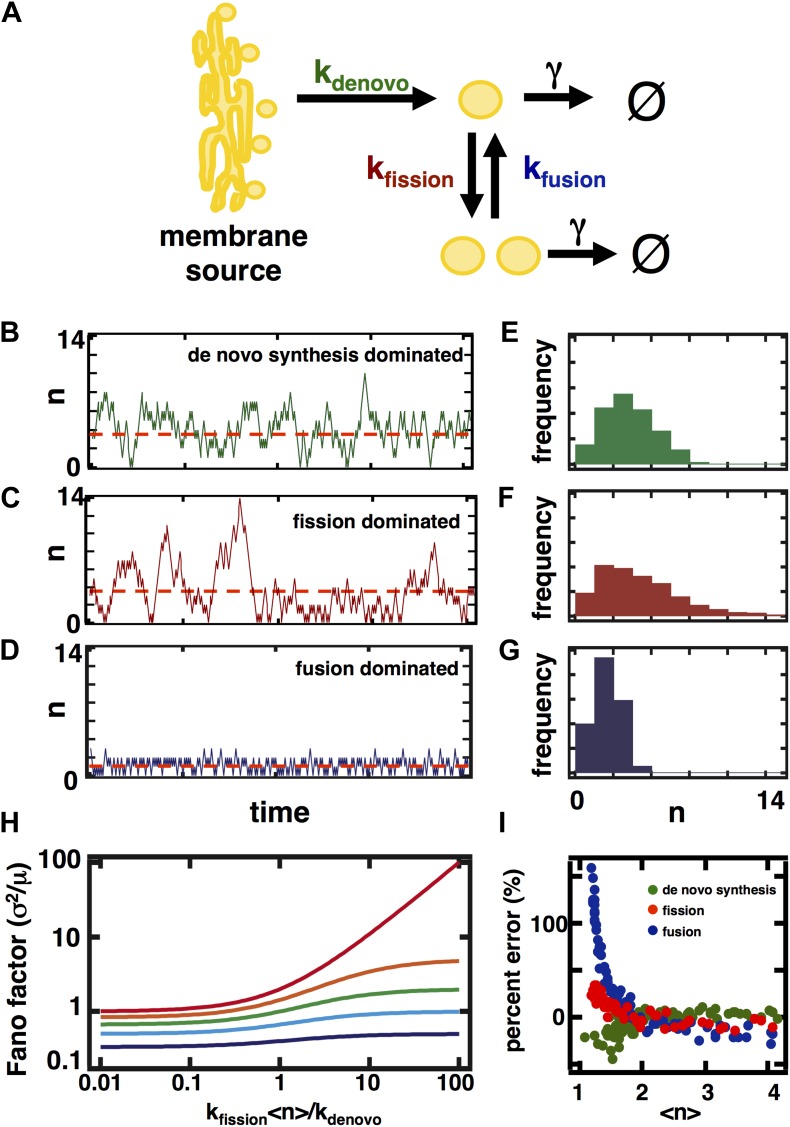
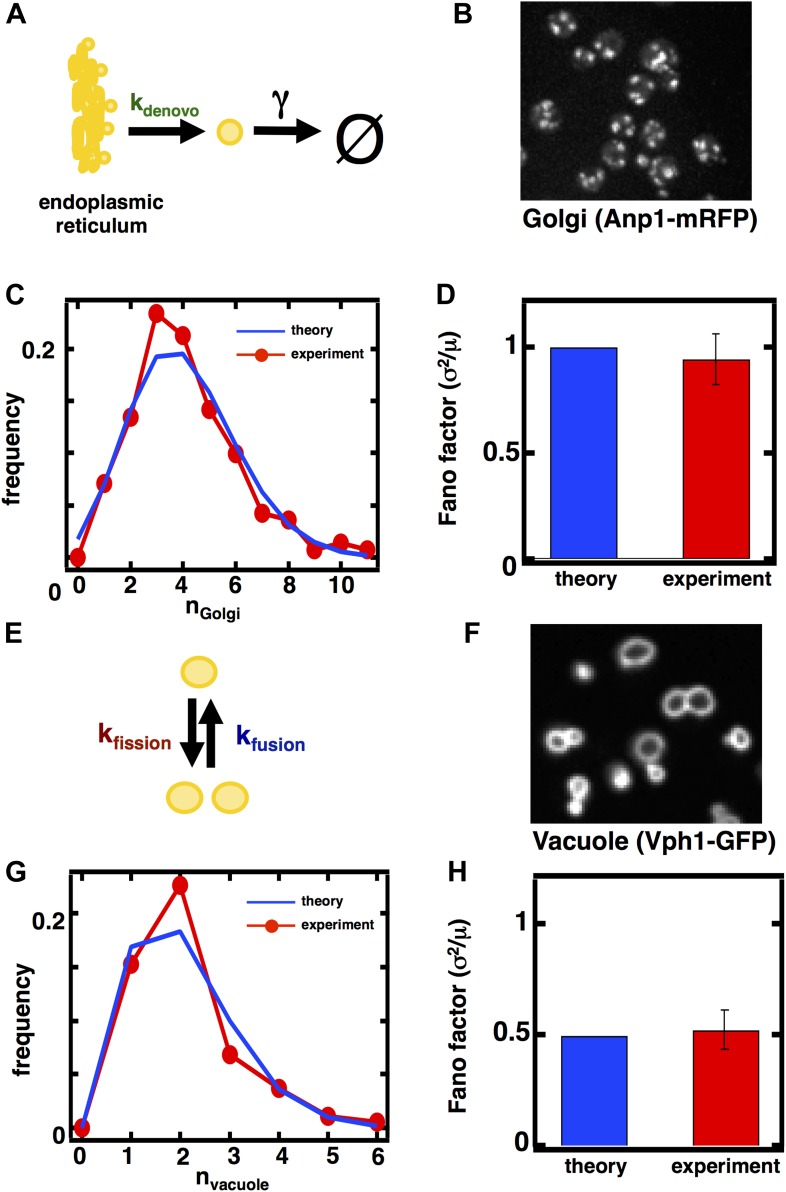
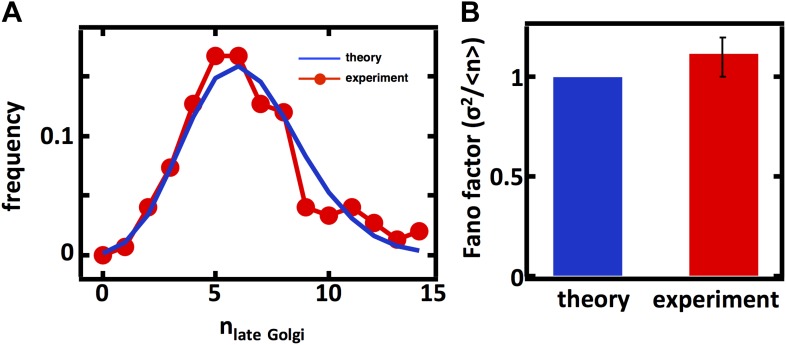
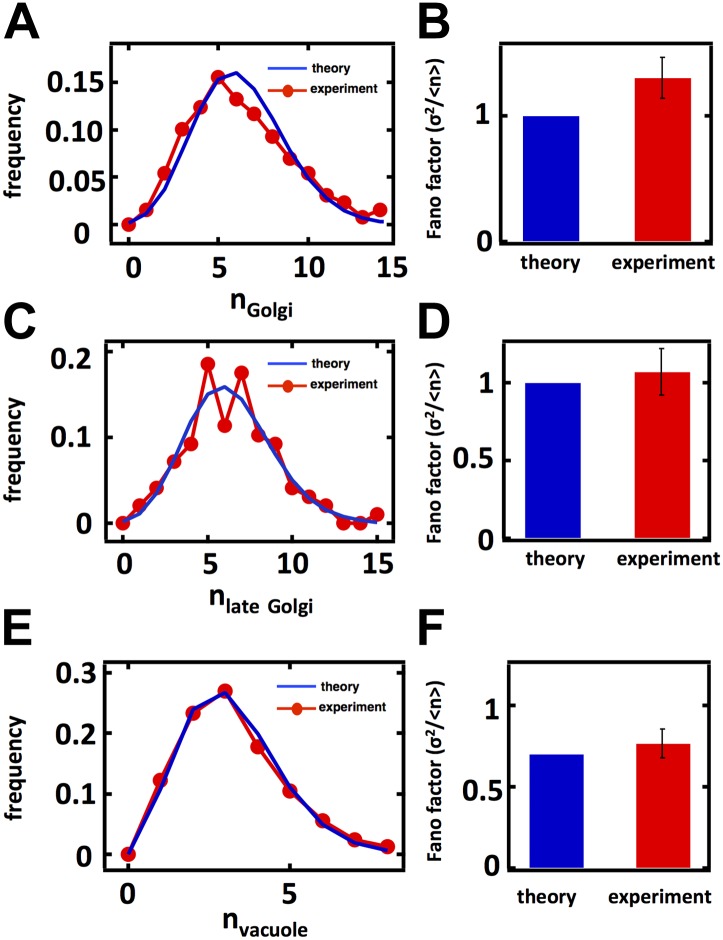
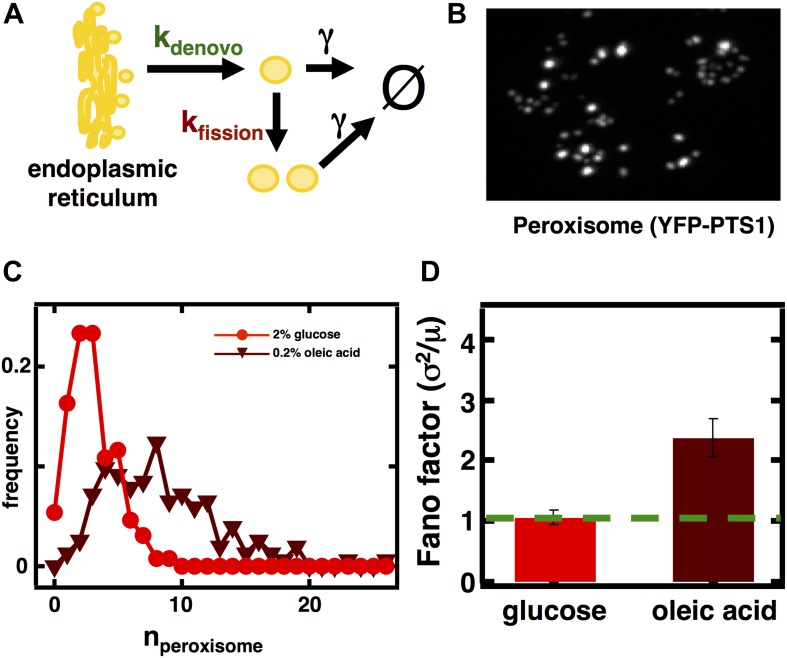
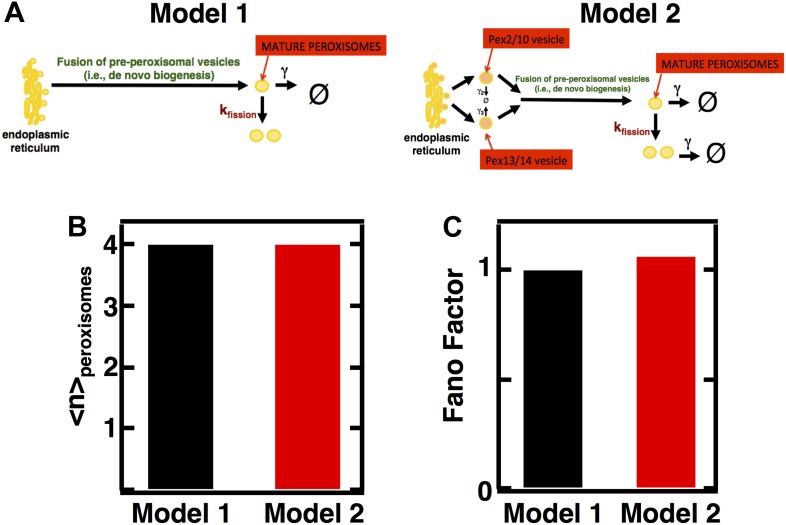
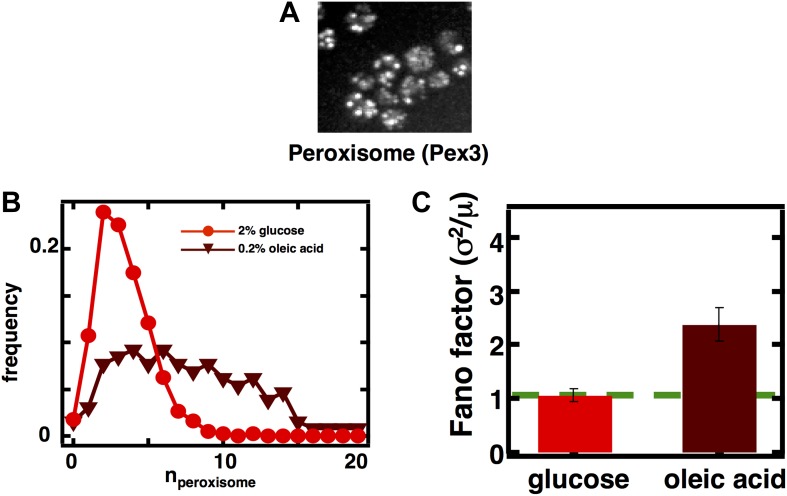
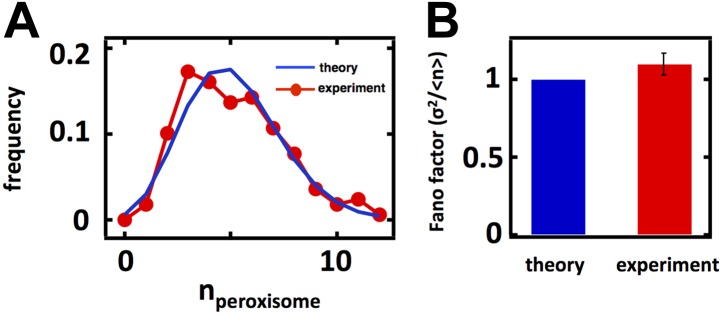
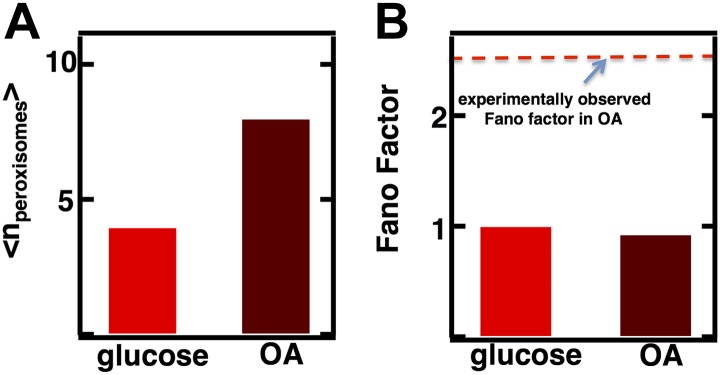
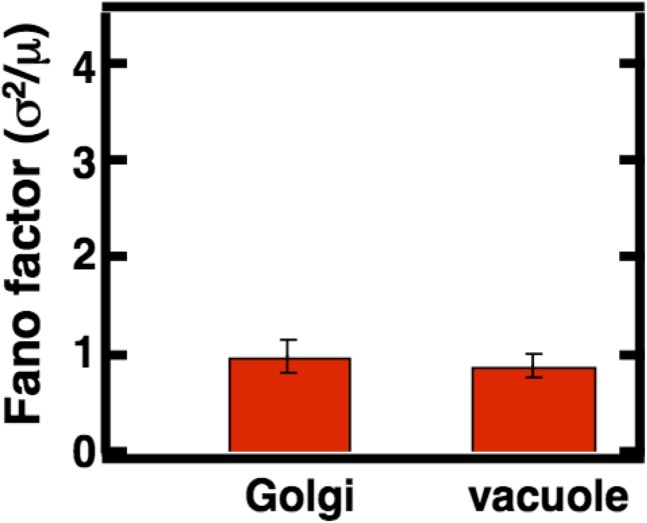
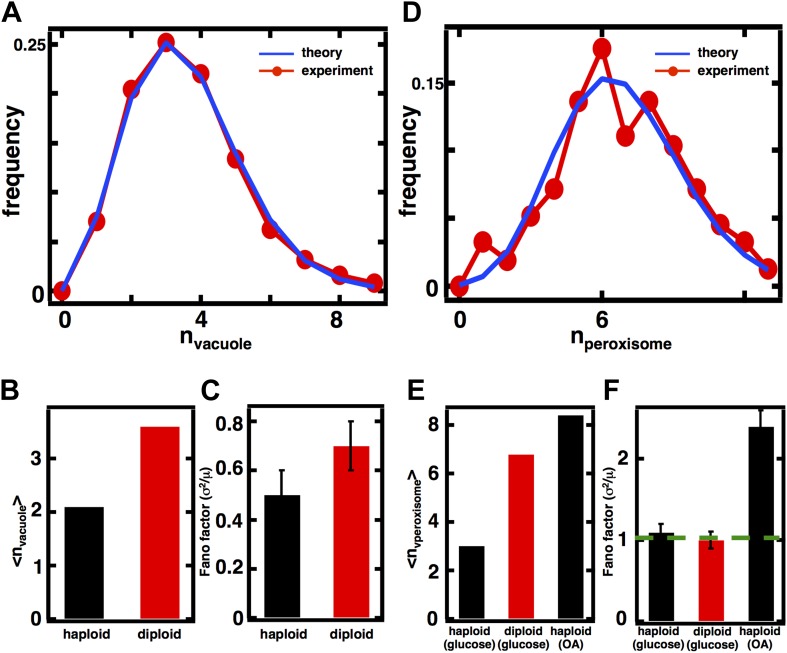
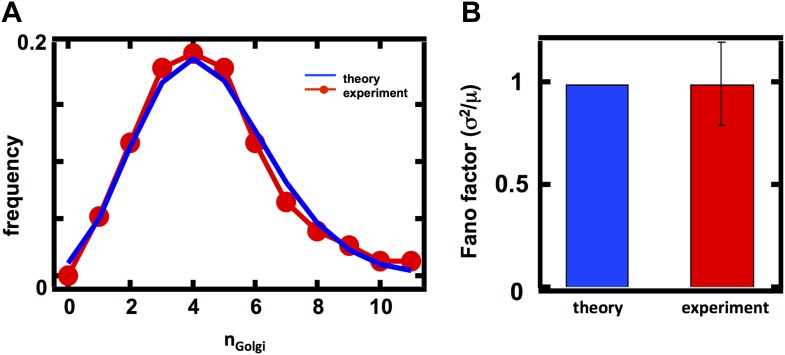
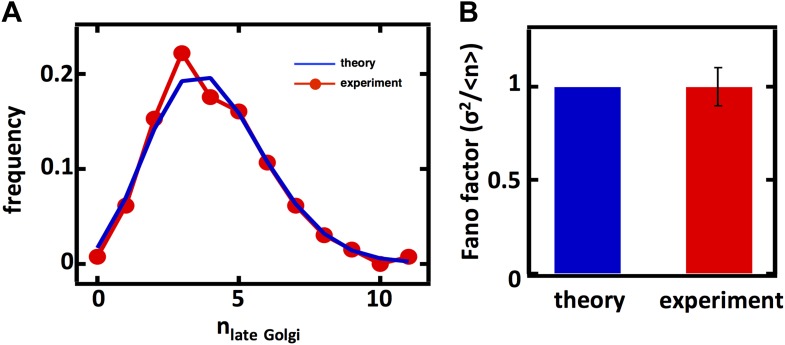
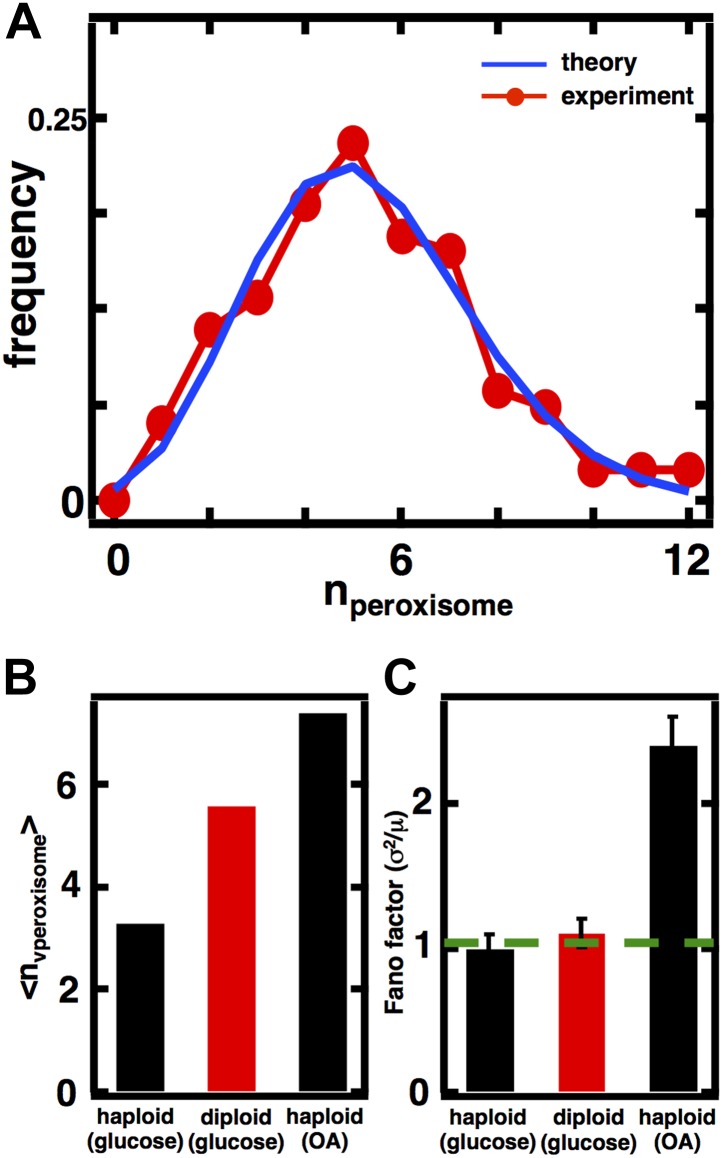
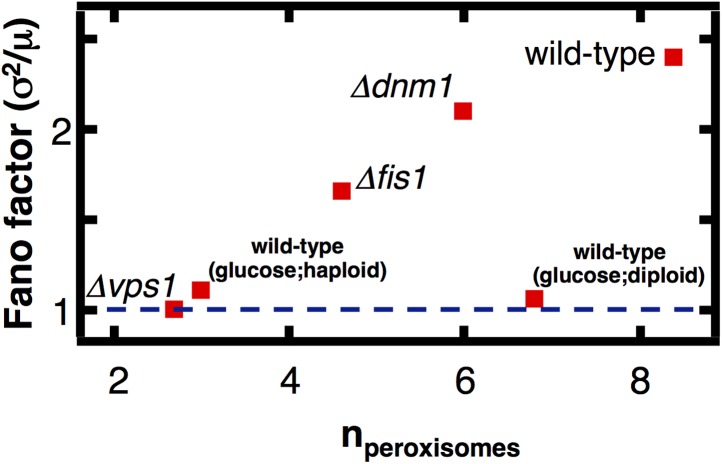
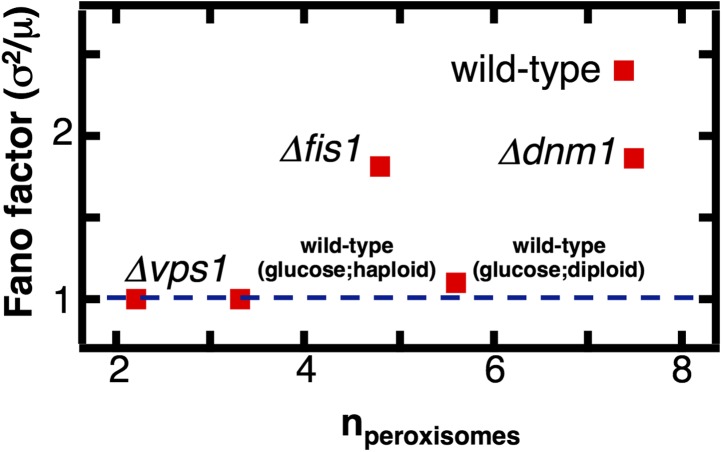
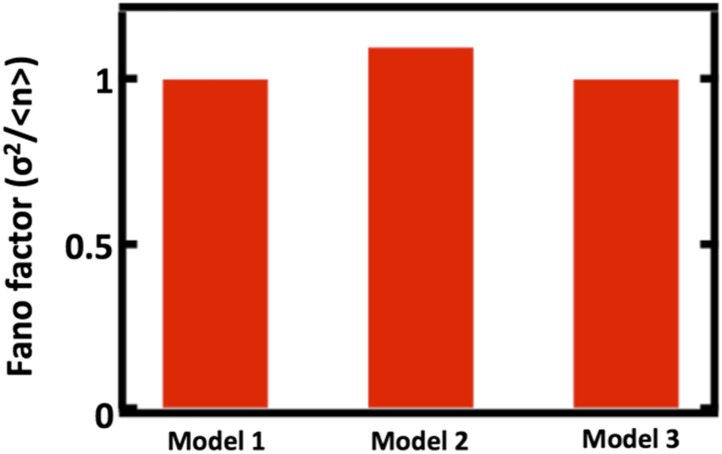
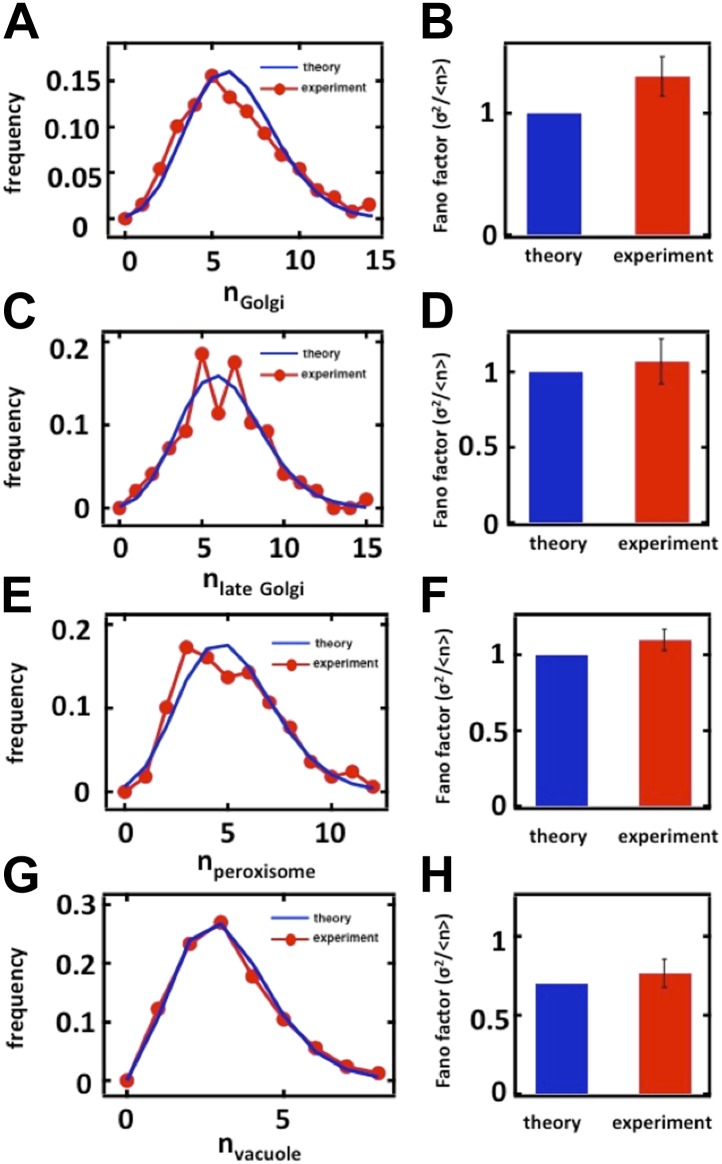
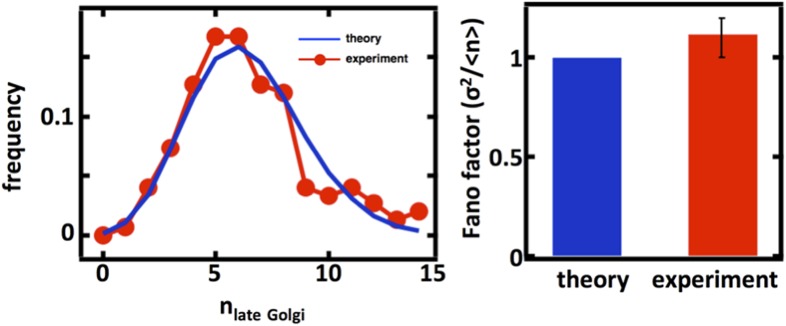
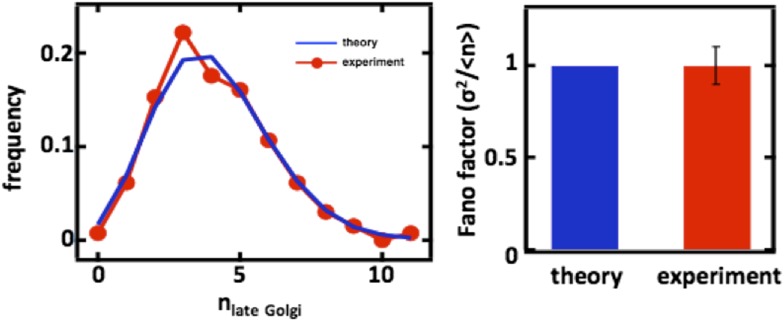
Fluctuations in organelle abundance can profoundly limit the precision of cell biological processes from secretion to metabolism. We modeled the dynamics of organelle biogenesis and predicted that organelle abundance fluctuations depend strongly on the specific mechanisms that increase or decrease the number of a given organelle. Our model exactly predicts the size of experimentally measured Golgi apparatus and vacuole abundance fluctuations, suggesting that cells tolerate the maximum level of variability generated by the Golgi and vacuole biogenesis pathways. We observe large increases in peroxisome abundance fluctuations when cells are transferred from glucose-rich to fatty acid-rich environments. These increased fluctuations are significantly diminished in mutants lacking peroxisome fission factors, leading us to infer that peroxisome biogenesis switches from de novo synthesis to primarily fission. Our work provides a general framework for exploring stochastic organelle biogenesis and using fluctuations to quantitatively unravel the biophysical pathways that control the abundance of subcellular structures.DOI: http://dx.doi.org/10.7554/eLife.02678.001.

Keywords: cell biology; fluctuations; mathematical modeling; organelles; systems biology.


Conflict of interest statement

EKO: Erin O'Shea is Chief Scientific Officer and a Vice President at the Howard Hughes Medical Institute, one of the three founding funders of eLife.

The other author declares that no competing interests exist.

Figures

Figure 1.
Figure 1.. A stochastic model of organelle abundance dynamics.
(A) Organelle abundances are governed by four distinct biophysical processes: (i) de novo synthesis (kde novo, with units per time); (ii) fission (kfission, with units per organelle per time); (iii) fusion (kfusion, with units per organelle squared per time); and (iv) decay (γ, with units per organelle per time). (B) Sample trajectory generated by a Gillespie simulation of the model depicted in (A) in which the parameters are chosen to allow de novo synthesis to dominate over fission, fusion, and decay. (C) Sample trajectory as in (B), but with parameters chosen to allow fission to dominate over de novo synthesis, fusion, and decay. (D) Sample trajectory as in (B), but with parameters chosen to allow fusion to dominated over de novo synthesis, fission, and decay. (E) Histogram of the number of organelles generated by Gillespie simulations with parameters chosen as in (B). (F) Histogram of number of organelles generated by Gillespie simulations with parameters chosen as in (C). (G) Histogram of number of organelles generated by Gillespie simulations with parameters chosen as in (D). (H) Analytical approximation of the variance of the organelle abundance distribution divided by the mean of the distribution, or Fano factor, as a function of the ratio of the fission to de novo synthesis rate for various values of the fusion rate; from top to bottom the curves are calculated in order of increasing fusion rates: 0 (red), 0.25 (orange), 1 (green), 10 (cyan), 100 (blue). The value of γ is selected such that the mean organelle abundance is held constant for every point along these curves. (I) Percent error in the Fano factor prediction from the analytical approximation compared to Fano factor calculated from Gillespie simulations of the reaction scheme. The percent error is computed as the de novo synthesis (green dots), fission (red dots), and fusion (blue dots) rate constants are varied to tune the mean organelle abundance from <n> ≈ 1 to <n> ≈ 4, with the percent error between the prediction and simulation reaching close to 0% at <n> ≈ 2. DOI: http://dx.doi.org/10.7554/eLife.02678.003
Figure 1—figure supplement 1.
Figure 1—figure supplement 1.. Comparison of Fano factors calculated from simulations of model with first order decay process (Model 1) with two alternative models substituting first order decay with partitioning at regular intervals.
In Model 2, first order decay is substituted for a decay process that reduces the organelle abundance by exactly one half at regular time intervals. In Model 3, first order decay is substituted for a decay process that reduces the organelle abundance through binomial partitioning to daughter cells at regular time intervals with the probability of organelle inheritance to each daughter p=0.5. DOI: http://dx.doi.org/10.7554/eLife.02678.004
Figure 2.
Figure 2.. Predicting the stochastic fluctuations in Golgi apparatus and vacuole abundances.
(A) Schematic depicting the biophysical processes that govern Golgi apparatus abundances. (B) Spinning disc confocal microscopy images of the Golgi apparatus as visualized by the fusion protein Anp1-mRFP. (C) Histograms depicting the theoretically predicted Golgi apparatus abundance distribution (blue trace) and experimentally measured single haploid cell Golgi apparatus abundance distribution (red trace). N = 141 cells were analyzed. (D) Bar graph depicting theoretical prediction (blue bar) and experimental measurement (red bar) of the Golgi apparatus abundance distribution Fano factor. (E) Schematic depicting the biophysical processes that govern vacuole abundances. Error bars are ±1 standard error of the mean, estimated by bootstrapping. (F) Spinning disc confocal microscopy images of the vacuole as visualized by the fusion protein Vph1 fused to green fluorescent protein (Vph1-GFP). (G) Histograms depicting the theoretically predicted vacuole abundance distribution (blue trace) and experimentally measured single haploid cell vacuole abundance distribution (red trace). N = 95 cells were analyzed. (H) Bar graph depicting theoretical prediction (blue bar) and experimental measurement (red bar) of the vacuole abundance distribution Fano factor. Error bars are ±1 standard error of the mean, estimated by bootstrapping. DOI: http://dx.doi.org/10.7554/eLife.02678.005
Figure 2—figure supplement 1.
Figure 2—figure supplement 1.. Predicting the stochastic fluctuations in late Golgi abundances.
(A) Histograms depicting the theoretically predicted late Golgi apparatus abundance distribution (blue trace) and experimentally measured single haploid cell late Golgi apparatus abundance distribution (red trace). N = 150 cells were analyzed. (B) Bar graph depicting theoretical prediction (blue bar) and experimental measurement (red bar) of the late Golgi apparatus abundance distribution Fano factor. Error bars are ±1 standard error of the mean, estimated by bootstrapping. DOI: http://dx.doi.org/10.7554/eLife.02678.006
Figure 2—figure supplement 2.
Figure 2—figure supplement 2.. Predicting stochastic fluctuations in Golgi, late Golgi and vacuole abundance distributions in budding yeast cells synchronized and arrested in S-phase of the cell cycle.
(A, C, E) Histograms depicting the theoretically predicted Golgi apparatus (A), late Golgi apparatus (C), and vacuole (E) abundance distributions (blue traces) and experimentally measured single haploid cell abundance distributions (red traces). N = 129 cells were analyzed in panel (A), N = 163 cells were analyzed in panel (C) and N = 97 cells were analyzed in panel (E). (B, D, F) Bar graphs depicting theoretical predictions (blue bars) and experimental measurements (red bars) of the Golgi apparatus (B), late Golgi apparatus (D), and vacuole (F) abundance distribution Fano factors. Error bars are ±1 standard error of the mean, estimated by bootstrapping. DOI: http://dx.doi.org/10.7554/eLife.02678.007
Figure 3.
Figure 3.. Inferring the dominant biophysical pathways in peroxisome biogenesis.
(A) Schematic depicting the biophysical processes that govern peroxisome abundances. (B) Spinning disc confocal microscopy images of the peroxisome as visualized by the fusion protein YFP-PTS1-mRFP. (C) Histograms depicting experimentally measured single cell peroxisome abundance distributions for haploid cells grown in 2% glucose (red circles) and haploid cells grown in 0.2% oleic acid (dark red triangles). N = 129 cells were analyzed in glucose medium and N = 153 cells were analyzed in oleic acid medium. (D) Bar graph depicting measured peroxisome abundance distribution Fano factors in glucose-rich and 0.2% oleic acid-rich media. The green dashed line indicates a Fano factor σ2/<n> = 1, marking the boundary between de novo synthesis and fission dominated organelle production. Figure 3—figure supplement 1 depicts a peroxisome biogenesis model, referred to as Model 2, alternative to the model depicted in panel (A). Figure 3—figure supplement 2 depicts data similar to panels (BD) but with Pex3-mRFP as the peroxisome marker. Figure 3—figure supplement 3 displays simulation results from Model 2 showing how increased pre-peroxisomal vesicle production affects the mean and Fano factor of the mature peroxisome abundance distribution. Figure 3—figure supplement 4 depicts the Fano factors of the Golgi apparatus and vacuole abundance distributions from cells grown in oleic acid-rich medium. Error bars are ±1 standard error of the mean, estimated by bootstrapping. DOI: http://dx.doi.org/10.7554/eLife.02678.008
Figure 3—figure supplement 1.
Figure 3—figure supplement 1.. Incorporating pre-peroxisomal vesicle fusion into the model of de novo peroxisome biogenesis.
(A) Schematics of Models 1 and 2. (B and C) Comparing the Fano factors (C) generated by one-step (Model 1) vs vesicle fusion based peroxisome biogenesis (Model 2) at equivalent mean peroxisome abundances (B). DOI: http://dx.doi.org/10.7554/eLife.02678.009
Figure 3—figure supplement 2.
Figure 3—figure supplement 2.. Measuring mature peroxisome abundance statistics using Pex3-mRFP as the peroxisomal marker.
(A) Spinning disc confocal image of budding yeast cells expressing Pex3-mRFP. (B) Single cell peroxisome abundance distribution obtained from Pex3-mRFP expressing yeast cells cultured in glucose medium (red circles) and oleic acid containing medium (maroon triangles). N = 447 cells were analyzed in glucose medium and N = 133 cells were analyzed in oleic acid medium. (C) Fano factors calculated from single cell peroxisome abundance distributions depicted in panel (B). Error bars are ±1 standard error of the mean, estimated by bootstrapping. DOI: http://dx.doi.org/10.7554/eLife.02678.010
Figure 3—figure supplement 3.
Figure 3—figure supplement 3.. Predicting stochastic fluctuations in peroxisome abundance distributions in budding yeast cells synchronized and arrested in S-phase of the cell cycle.
(A) Histograms depicting the theoretically predicted peroxisome abundance distribution (blue trace) and experimentally measured single haploid cell peroxisome abundance distribution (red trace). N = 168 cells were analyzed. (B) Bar graph depicting theoretical prediction (blue bar) and experimental measurement (red bar) of the peroxisome abundance distribution Fano factor. Error bars are ±1 standard error of the mean, estimated by bootstrapping. DOI: http://dx.doi.org/10.7554/eLife.02678.011
Figure 3—figure supplement 4.
Figure 3—figure supplement 4.. Effect of increasing pre-peroxisomal vesicle production in Model 2 on mean and mature peroxisome abundance distribution Fano factors.
DOI: http://dx.doi.org/10.7554/eLife.02678.012
Figure 3—figure supplement 5.
Figure 3—figure supplement 5.. Golgi and vacuole abundance distribution Fano factors obtained from cells cultured in oleic acid rich medium.
Error bars are ±1 standard error of the mean, estimated by bootstrapping. N = 114 cells were analyzed in the case of the Golgi and N = 138 cells were analyzed in the case of the vacuole. DOI: http://dx.doi.org/10.7554/eLife.02678.013
Figure 4.
Figure 4.. Predicting organelle abundance fluctuations in diploid cells.
(A) Histograms depicting the theoretically predicted vacuole abundance distribution (blue trace) and experimentally measured single diploid cell vacuole abundance distribution (red trace). N = 127 cells were analyzed. (B and C) Bar charts comparing experimentally measured vacuole abundance means (B) and Fano factors (C) in haploid and diploid cells cultured in glucose-rich medium. (D) Histograms depicting the theoretically predicted peroxisome distributions (blue trace) and experimentally measured single diploid cell peroxisome abundance distributions (red trace). N = 154 cells were analyzed. (E and F) Bar charts comparing experimentally measured peroxisome means (E) and Fano factors (F) in haploid and diploid cells cultured in glucose-rich or oleic acid (OA) medium. Green line in panel (F) indicate Fano factor of 1. Error bars are ±1 standard error of the mean, estimated by bootstrapping. Figure 4—figure supplement 1 displays the Golgi apparatus abundance distribution and its Fano factor from diploid cells grown in glucose-rich medium. Figure 4—figure supplement 2 depicts data similar to panels (DF) but with Pex3-mRFP as the peroxisome marker. DOI: http://dx.doi.org/10.7554/eLife.02678.014
Figure 4—figure supplement 1.
Figure 4—figure supplement 1.. Golgi apparatus abundance fluctuations in diploid cells.
(A) Single cell histogram of Golgi apparatus count (red trace) compared to theoretically calculated Poisson distribution based on measured Golgi apparatus mean (blue trace). N = 77 cells were analyzed. (B) Fano factor measured from Golgi apparatus abundance distribution compared to theoretical prediction from Equation 1. Error bars are ±1 standard error of the mean, estimated by bootstrapping. DOI: http://dx.doi.org/10.7554/eLife.02678.015
Figure 4—figure supplement 2.
Figure 4—figure supplement 2.. Late Golgi apparatus abundance fluctuations in diploid cells.
(A) Single cell histogram of late Golgi apparatus count (red trace) compared to theoretically calculated Poisson distribution based on measured late Golgi apparatus mean (blue trace). N = 131 cells were analyzed. (B) Fano factor measured from late Golgi apparatus abundance distribution compared to theoretical prediction from Equation 1. Error bars are ±1 standard error of the mean, estimated by bootstrapping. DOI: http://dx.doi.org/10.7554/eLife.02678.016
Figure 4—figure supplement 3.
Figure 4—figure supplement 3.. Peroxisome abundance fluctuations in diploid cells measured by Pex3-mRFP.
(A) Single cell histogram of peroxisome count (red trace) compared to theoretically calculated Poisson distribution based on measured peroxisome mean (blue trace). N = 123 cells were analyzed. (B) Mean peroxisome abundance from diploid cells cultured in glucose medium compared to haploid cells cultured in glucose medium and oleic acid medium. (C) Fano factor measured from peroxisome abundance distribution from diploid cells compared to haploid cells cultured in glucose medium and in oleic acid medium. The green dashed line represents a Fano factor of 1. Error bars are ±1 standard error of the mean, estimated by bootstrapping. DOI: http://dx.doi.org/10.7554/eLife.02678.017
Figure 5.
Figure 5.. The effect of fission factor deletions on peroxisome abundance statistics.
Budding yeast cells containing peroxisomes labeled by YFP-PTS1 and lacking one of the peroxisome fission factors VPS1, DNM1 or its accessory factor FIS1 were cultured in medium containing 0.2% oleic acid for 20 hr. Single cell peroxisome abundance distributions were measured for each of these strains. The Fano factors are plotted as a function of mean peroxisome abundance extracted from the single cell peroxisome distributions. Figure 5—figure supplement 1 shows data similar to Figure 5 but with Pex3-mRFP as the peroxisome marker. DOI: http://dx.doi.org/10.7554/eLife.02678.018
Figure 5—figure supplement 1.
Figure 5—figure supplement 1.. Peroxisome abundance fluctuations in cells containing deletions of the fission factors Dnm1, Fis1 and Vps1 measured labeling of peroxisomes by Pex3-mRFP.
DOI: http://dx.doi.org/10.7554/eLife.02678.019
Author response image 1.
Comparing Fano factors obtained from simulations of models with alternative organelle decay processes. Model 1 implements first order decay, Model 2 implements reducing the organelle number by half at defined time intervals, and Model 3 implements reducing organelle number in a given cell by binomial partitioning of the organelles into daughter cells.
Author response image 2.
Organelle abundance distributions and their Fano factors measured from budding yeast cells arrested in S phase with hydroxyurea. (A, B) Anp1-GFP, (C, D) Sec7-GFP, (E, F) Pex3-GFP, (G, H) Vph1-GFP.
Author response image 3.
Late Golgi abundance distribution (left panel) and its Fano factor (right panel) in haploid budding yeast cells, measured using Sec7-GFP as a late Golgi marker.
Author response image 4.
Late Golgi abundance distribution (left panel) and its Fano factor (right panel) in diploid budding yeast cells, measured using Sec7-GFP as a late Golgi marker.

References

    1. Banta LM, Robinson JS, Klionsky DJ, Emr SD. 1988. Organelle assembly in yeast: characterization of yeast mutants defective in vacuolar biogenesis and protein sorting. The Journal of Cell Biology 107:1370–1383. doi: 10.1083/jcb.107.4.1369 - DOI - PMC - PubMed
    1. Bevis BJ, Hammond AT, Reinke CA, Glick BS. 2002. De novo formation of transitional ER sites and Golgi structures in Pichia pastoris. Nature Cell Biology 4:750–756. doi: 10.1038/ncb852 - DOI - PubMed
    1. Bhave M, Papanikou E, Iyer P, Pandya K, Jain BK, Ganguly A, Sharma C, Pawar K, Austin J, II, Day KJ, Rossanese OW, Glick BS, Bhattacharyya D. 2014. Golgi enlargement in Arf-depleted yeast cells is due to altered dynamics of cisternal maturation. Journal of Cell Science 127:250–257. doi: 10.1242/jcs.140996 - DOI - PMC - PubMed
    1. Catlett NL, Weisman LS. 2000. Divide and multiply: organelle partitioning in yeast. Current Opinion in Cell Biology 12:509–516. doi: 10.1016/S0955-0674(00)00124-1 - DOI - PubMed
    1. Chan YH, Marshall WF. 2010. Scaling properties of cell and organelle size. Organogenesis 6:88–96. doi: 10.4161/org.6.2.11464 - DOI - PMC - PubMed

Publication types

MeSH terms

LinkOut - more resources