

Phylogenetic tree shapes resolve disease transmission patterns
- PMID: 24916411
- PMCID: PMC4097963
- DOI: 10.1093/emph/eou018
Phylogenetic tree shapes resolve disease transmission patterns
Abstract
Background and objectives: Whole-genome sequencing is becoming popular as a tool for understanding outbreaks of communicable diseases, with phylogenetic trees being used to identify individual transmission events or to characterize outbreak-level overall transmission dynamics. Existing methods to infer transmission dynamics from sequence data rely on well-characterized infectious periods, epidemiological and clinical metadata which may not always be available, and typically require computationally intensive analysis focusing on the branch lengths in phylogenetic trees. We sought to determine whether the topological structures of phylogenetic trees contain signatures of the transmission patterns underlying an outbreak.
Methodology: We use simulated outbreaks to train and then test computational classifiers. We test the method on data from two real-world outbreaks.
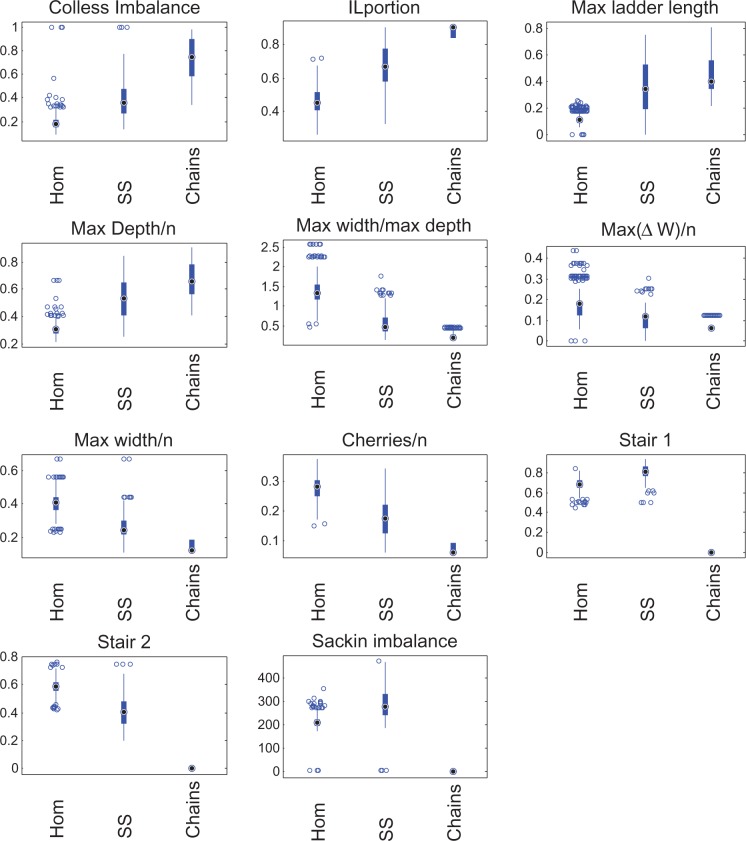
Results: We show that different transmission patterns result in quantitatively different phylogenetic tree shapes. We describe topological features that summarize a phylogeny's structure and find that computational classifiers based on these are capable of predicting an outbreak's transmission dynamics. The method is robust to variations in the transmission parameters and network types, and recapitulates known epidemiology of previously characterized real-world outbreaks.
Conclusions and implications: There are simple structural properties of phylogenetic trees which, when combined, can distinguish communicable disease outbreaks with a super-spreader, homogeneous transmission and chains of transmission. This is possible using genome data alone, and can be done during an outbreak. We discuss the implications for management of outbreaks.
Keywords: computational modelling; evolutionary epidemiology; genomic epidemiology; machine learning.
© The Author(s) 2014. Published by Oxford University Press on behalf of the Foundation for Evolution, Medicine, and Public Health.
Figures


References
-
- Stadler T, Kouyos R, Von Wyl V. et al. Estimating the basic reproductive number from viral sequence data. Mol Biol Evol 2012;29:347–57. - PubMed
LinkOut - more resources
Full Text Sources
Other Literature Sources
