. 2014 Dec 21;43(47):17567-77.
doi: 10.1039/c4dt01366b.

Excited state potential energy surfaces and their interactions in Fe(IV)=O active sites

Affiliations

Excited state potential energy surfaces and their interactions in Fe(IV)=O active sites

Martin Srnec et al. Dalton Trans. .

Abstract

The non-heme ferryl active sites are of significant interest for their application in biomedical and green catalysis. These sites have been shown to have an S = 1 or S = 2 ground spin state; the latter is functional in biology. Low-temperature magnetic circular dichroism (LT MCD) spectroscopy probes the nature of the excited states in these species including ligand-field (LF) states that are otherwise difficult to study by other spectroscopies. In particular, the temperature dependences of MCD features enable their unambiguous assignment and thus determination of the low-lying excited states in two prototypical S = 1 and S = 2 NHFe(IV)[double bond, length as m-dash]O complexes. Furthermore, some MCD bands exhibit vibronic structures that allow mapping of excited-state interactions and their effects on the potential energy surfaces (PESs). For the S = 2 species, there is also an unusual spectral feature in both near-infrared absorption and MCD spectra - Fano antiresonance (dip in Abs) and Fano resonance (sharp peak in MCD) that indicates the weak spin-orbit coupling of an S = 1 state with the S = 2 LF state. These experimental data are correlated with quantum-chemical calculations that are further extended to analyze the low-lying electronic states and the evolution of their multiconfigurational characters along the Fe-O PESs. These investigations show that the lowest-energy states develop oxyl Fe(III) character at distances that are relevant to the transition state (TS) for H-atom abstraction and define the frontier molecular orbitals that participate in the reactivity of S = 1 vs. S = 2 non-heme Fe(IV)[double bond, length as m-dash]O active sites. The S = 1 species has only one available channel that requires the C-H bond of a substrate to approach perpendicular to the Fe-oxo bond (the π channel). In contrast, there are three channels (one σ and two π) available for the S = 2 non-heme Fe(IV)[double bond, length as m-dash]O system allowing C-H substrate approach both along and perpendicular to the Fe-oxo bond that have important implications for enzymatic selectivity.


Figures
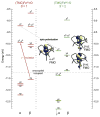
Figure 1
Figure 1
MO diagrams of (CH3CN)(TMC)FeIV=O in S = 1 (ground) and S = 2 spin states, showing that excitation of β-dxy e into α-dx2–y2 orbital leads to spin polarization of the α-manifold and an additional low-energy α-dz2 FMO available for reactivity.
Figure 2
Figure 2
Two crystallographically characterized NHFeIV=O complexes (crystal structures from Refs. and 31). Atoms are color-coded as follows: C (green), N (blue), O (red) and Fe (orange). The d-manifold splittings in both C4v- and C3v-like symmetric structures, along with electron occupations, are qualitatively depicted.
Figure 3
Figure 3
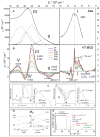
A. The 233 K absorption spectrum and B. VT MCD spectra of the S = 1 (CH3CN)(TMC)FeIV=O model complex (adapted from Ref. 20). Temperature-dependent behaviors of bands I, II and III interpreted based on zero-field and magnetic-field splitting diagram (C), giving definitive band assignments. D. Vibronic progression of band II (40 K; plotted positive). E. MO diagram producing two degenerate dπ* FMOs and dσ* LUMO. F. Parabolic representations of ground- and excited-state potential surfaces of (CH3CN)(TMC)FeIV=O showing origin of reduced-frequency excited-state vibronic progression in MCD data in panel D.
Figure 4
Figure 4
A. The 233 K absorption spectrum of the S = 2 (TMG3tren)FeIV=O complex (adapted from Ref. 22). The Abs spectrum (bold dark blue) in the 16000–30000 cm−1 region fit by five Gaussians (dotted black lines). B. Variable-temperature (VT) MCD spectra. For the three lowest-energy spectral features (I, II and III), their polarizations along with C0/D0 parameters are shown. C. VT MCD features I and II for 5-mM and10-mM samples, respectively (left and right boxes) along with temperature-dependence behaviors of MCD intensities I and II (taken at the energies as indicated by *), overlaid with red and green lines simulating pure (x,y)-pol. and z-pol. behaviors for D of +7.0 and +7.5 cm−1, respectively (left and right graphs). D. Splitting of MS sublevels of an S = 2 species with an applied field H. E. TD-DFT-calculated electronic transitions (for technical details see SI of Ref. 22). Dominant character and polarization are indicated. Note the (x,y)-polarized Neq-based CT transition calculated to be between the two lowest-energy z-polarized oxo CT transitions is ruled out as the assignment of the 23000 cm−1 band in MCD by both its polarization from VT MCD and by resonance Raman data (Ref. 31).
Figure 5
Figure 5
A. C3v ligand field with a strong oxo axial ligand produces MO orbitals, where d-manifold splits into two degenerate non-bonding d orbitals, two degenerate antibonding dπ* FMOs and the dσ* LUMO. B. The LF 5E excited state results from the e excitation from the dπ* to dσ* orbital; the transition is (x,y)-polarized in C3v. C. In-state SOC splitting of the LF 5E along with zero-field splitting of the ground state 5A1, further split by external magnetic field along z. MCD-active sublevels labeled in terms of (MLeff, MS); Left and right circularly polarized (LCP and RCP) transitions are indicated by vertical arrows.
Figure 6
Figure 6
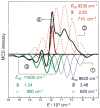
A. NIR MCD spectrum at 2 K (solid black line) fit with three FC progressions and one sharp peak, where E00 corresponds to the zero-vibronic transition (the energy of the first peak in each progression); S is the Huang-Rhys factor and ν is the vibronic spacing.
Figure 7
Figure 7
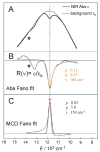
A. NIR Abs spectrum showing a dip in background profile; B. Fano fit (orange line) of dip in NIR Abs to give black line R(ν)). Instrument detector changeover in region indicated by * results in a spurious derivative feature in the difference spectrum. C. Fano analysis of sharp transition in MCD (red line obtained by eliminating the LF 5E-based MCD background intensity). Both the dip in Abs and peak in MCD were fit with equation 4.
Figure 8
Figure 8
A. Parabolic PESs of the ground and low-lying excited states derived from FC analyses of MCD features I and II from Figure 4B and 6. B. The lowest CASPT2 S = 2 excited state interacting with two S = 1 states. State levels without and with SOC (left and right column, respectively) calculated at the ground-state geometric equilibrium. Computational details given in Ref. . The vertical arrows indicate the RCP and LCP transitions that contribute to the NIR MCD pseudo-A term from Figure 6. MCD-active sublevels labeled in terms of (MLeff, MS) C. The (SOC-perturbed) CASPT2 PESs. Owing to strong SOC between the (−1, −1) component of LF 5E and 3E, two RCP-active PESs are produced (inset). D. Evolution of the two dominant electronic configurations contributing to the multiconfigurational wavefunction characters of each electronic state (5A1 ground state and LF 5E). Configurations depicted correlate with the MOs diagram given in Figure 5A. Note, throughout the entire Figure, labels for states and their PESs (1 through 4) are the same as those used for the corresponding FC progressions and the sharp peak in Figure 6 (the oxo-to-Fe CT state is state 5 and corresponds to MCD feature II in Figure 4B).
Scheme 1
Scheme 1
The dπ* FMO interacting with the electron-donating C—H σ orbital (left) and thus defining H-atom abstraction reaction coordinate for the S = 1 NHFeIV=O species (right).
Scheme 2
Scheme 2
The dσ* and dπ* FMOs interacting with the electron-donating C—H σ orbital defining possible H-atom abstraction reaction coordinates for an S = 2 NHFeIV=O species (right).
Scheme 3
Scheme 3
Vibronically resolved VT MCD spectra calibrate the theoretical PESs allowing the evaluation of their wavefunction evolution and FMOs along the Fe—O bond stretch that govern mechanism for H-atom abstraction in S = 1 vs. S = 2 NHFeIV=O species.

References

    1. Solomon EI, Brunold TC, Davis MI, Kemsley JN, Lee SK, Lehnert N, Neese F, Skulan AJ, Yang YS, Zhou J. Chem Rev. 2000;100:235. - PubMed
    1. Que L, Jr, Ho RYN. Chem Rev. 1996;96:2607. - PubMed
    1. Solomon EI, Light KM, Liu LV, Srnec M, Wong SD. Acc Chem Res. 2013;46:2725. - PMC - PubMed
    1. Pau MY, Lipscomb JD, Solomon EI. Proc Natl Acad Sci USA. 2007;104:18355. - PMC - PubMed
    1. Kovaleva EG, Niebergall MB, Chakrabarty S, Lipscomb JD. Acc Chem Res. 2007;40:475. - PMC - PubMed

Publication types