. 2014 Oct;62(10):1608-28.
doi: 10.1002/glia.22703. Epub 2014 Jun 10.

Reactive microglia and macrophage facilitate the formation of Müller glia-derived retinal progenitors

Affiliations

Reactive microglia and macrophage facilitate the formation of Müller glia-derived retinal progenitors

Andy J Fischer et al. Glia. 2014 Oct.

Abstract

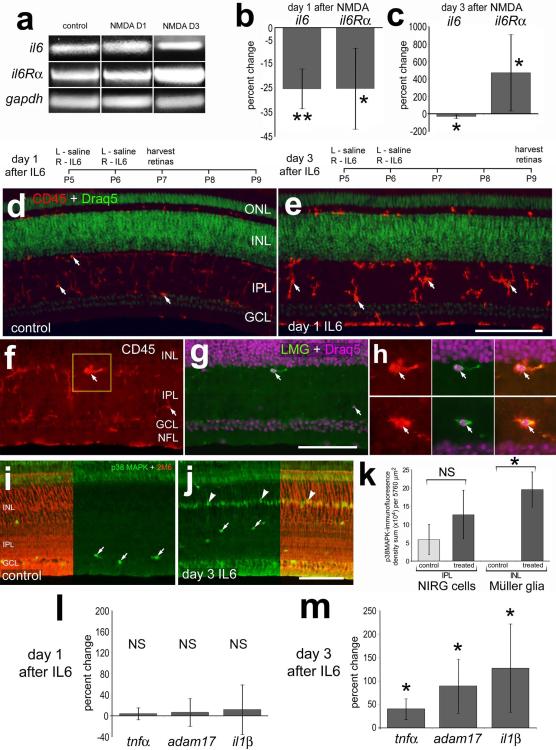
In retinas where Müller glia have been stimulated to become progenitor cells, reactive microglia are always present. Thus, we investigated how the activation or ablation of microglia/macrophage influences the formation of Müller glia-derived progenitor cells (MGPCs) in the retina in vivo. Intraocular injections of the Interleukin-6 (IL6) stimulated the reactivity of microglia/macrophage, whereas other types of retinal glia appear largely unaffected. In acutely damaged retinas where all of the retinal microglia/macrophage were ablated, the formation of proliferating MGPCs was greatly diminished. With the microglia ablated in damaged retinas, levels of Notch and related genes were unchanged or increased, whereas levels of ascl1a, TNFα, IL1β, complement component 3 (C3) and C3a receptor were significantly reduced. In the absence of retinal damage, the combination of insulin and Fibroblast growth factor 2 (FGF2) failed to stimulate the formation of MGPCs when the microglia/macrophage were ablated. In addition, intraocular injections of IL6 and FGF2 stimulated the formation of MGPCs in the absence of retinal damage, and this generation of MGPCs was blocked when the microglia/macrophage were absent. We conclude that the activation of microglia and/or infiltrating macrophage contributes to the formation of proliferating MGPCs, and these effects may be mediated by components of the complement system and inflammatory cytokines.

Keywords: Müller glia; cellular proliferation; microglia; regeneration; retina.


Figures

Figure 1
Figure 1
il6 and il6α-receptor are expressed in normal and NMDA-damaged retinas, and IL6 stimulates the reactivity of microglia and increase levels of pro-inflammatory cytokines. RT-PCR (a) and qRT-PCR (b,c,l,m) were used to detect il6 and il6α-receptor. Histograms in b and c illustrate the mean (±SD; n≥4) percentage change of il6 and il6α-receptor at day 1 (b) and day 3 (c) after treatment with 2 μmol NMDA. (d-m) Retinas were obtained from eyes 1 or 3 days after the last of 2 consecutive daily injections of IL6 or saline (control). Retinal sections were labeled with DRAQ5 (green in d and e; magenta in g and h) and antibodies to CD45 (red; d-f and h), LMG (green; g and h), p38 MAPK (green; i and j), or TopAP (2M6; red; i and j). Arrows indicate microglia (d-h) or presumptive NIRG cells (i and j), and arrow-heads indicate the nuclei of Müller glia (j). The scale bar (50 μm) in panel e applies to d and e, the bar in g applies f and g, and the bar in j applies to i and j. The histogram in k illustrates the mean (±SD; n=5) density sum for p38 MAPK-immunofluorescence above threshold in the IPL or INL at 3 days after IL6-treatment. Histograms in l and m illustrate the mean (±SD; n=4) percentage change of il1β, adam17 and tnfα at day 1 and day 3 after treatment with IL6. Significance of difference (**p<0.01, *p<0.05, NS – not significant) was determined by using a Mann-Whitney U test. Abbreviations: ONL – outer nuclear layer, INL – inner nuclear layer, IPL – inner plexiform layer, GCL – ganglion cell layer, NFL – nerve fiber layer, gapdh - Glyceraldehyde 3-phosphate dehydrogenase, NMDA – N-methyl-D-aspartate.
Figure 2
Figure 2
Müller glia in normal and damaged retinas are not affected by and do not accumulate DiI-labeled clodronate-liposomes. IL6±clodronate/DiI-liposomes were injected into eyes and retinas harvested at 4hrs, 1, 2, or 5 days later. Alternatively, eyes were injected with NMDA at day 5 and retinas harvested at day 7. Retinal sections were labeled with DRAQ5 (magenta; a), and antibodies to CD45 (green or grayscale; a-i), Sox9 (magenta; j) Sox2 (red; k-m) or transitin (green; j-m). The DiI-labeled liposomes appear as red puncta (a-j). Arrows indicate DiI-liposomes, small double-arrows indicate microglia, and hollow arrow-heads indicate the nuclei of Müller glia. The areas boxed-out (yellow) in panels a-c, i and j are enlarged 2.5-fold in the adjacent panels. The histogram in n illustrated the mean (±SD; n=5) number of Müller glia at 1, 5 and 7 days after treatment. ANOVA indicated no significant difference. The scale bar (50 μm) in panel a applies to a alone, the bar in f applies to e and f, the bar in i applies to b,c,i and j, and the bar in m applies to k-m. Abbreviations: ONL – outer nuclear layer, INL – inner nuclear layer, IPL – inner plexiform layer, GCL – ganglion cell layer, NFL – nerve fiber layer.
Figure 3
Figure 3
Ablation of the microglia and NIRG cells reduces the number of proliferating MGPCs in NMDA-damaged retinas. Eyes were injected with IL6 alone (control) or IL6 and clodronate-liposomes (treated) at P5, NMDA at P10, BrdU at P12, and retinas harvested at P13. Retinal sections were labeled with DRAQ5 (red; a and b) and antibodies to CD45 (green; a and b), Nkx2.2 (red; c and d), Sox9 (green; c and d), Sox2 (red; f-i) and BrdU (green; f-i). Images of the retina were obtained from central (a-d, f and g) and peripheral (h and i) regions. Arrows indicate Sox9+ Sox2+ Nkx2.2+ NIRG cells (c, d and f-i), arrow-heads indicate Sox2+ Sox9+ Nkx2.2− nuclei of Müller glia (c, d and f-i), and small double-arrows indicate BrdU+/Sox2 negative cells that are proliferating microglia (f and h). The scale bar (50 μm) in panel i applies to a-d and f-i. e, j,k; mean (±SD; n≥9) number of BrdU-positive Müller glia and NIRG cells in central and peripheral regions of control and treated retinas. Significance of difference (*p<0.01, **p<0.0001) was determined by using an unpaired, two-tailed t-test. Abbreviations: ONL – outer nuclear layer, INL – inner nuclear layer, IPL – inner plexiform layer, GCL – ganglion cell layer, RPE – retinal pigmented epithelium.
Figure 4
Figure 4
The ablation of the microglia and NIRG cells influences retinal levels of ascl1a, inflammatory cytokines and component of the complement system. qRT-PCR (a and c) and RT-PCR (b) were used to detect retinal mRNA for cd45, Notch-related genes, bHLH transcription factors, inflammatory cytokines and components of the complement system. cDNA or retinal sections were generated from individual retinas (n≥4) that were treated with IL6 alone (control) or IL6+clodronate-liposomes (treated) at P5, NMDA at P10 and harvested at P13. Significance of difference (*p<0.05) was determined by using a Mann-Whitney U test. Retinal sections were immunolabeled and confocal microscopy was used to detect Pax6 (green), Sox2 (red), and Sox9 (blue) in retinas treated with IL6/NMDA (d and e) or IL6/clodronate/NMDA (f and g). Arrows indicate the nuclei of Müller glia and/or MGPCs. The scale bar (50 μm) in panel g applies to d-g. The histogram in h illustrates the mean (±SD; n=9) pixel value for the green channel (Pax6) within the nuclei of Sox2/Sox9-positive Müller glia in the INL and ONL. Significance of difference (NS, p>0.05) was calculated by using an unpaired, two-tailed t-test. Abbreviations: INL – inner nuclear layer, RT – reverse transcriptase, bHLH – basic helix-loop-helix, gapdh - Glyceraldehyde 3-phosphate dehydrogenase, NMDA – N-methyl-D-aspartate.
Figure 5
Figure 5
The ablation of the microglia and NIRG cells prevents the proliferation of MGPCs in retinas treated with insulin and FGF2. Eyes were injected with IL6 alone (control; a, c, e-h) or IL6 and clodronate-liposomes (treated; b, d, i-l) at P17, the combination of BrdU, insulin and FGF2 at P20-P22, BrdU at P23, and retinas harvested at P24. Retinal sections were immunolabeled for CD45 (a,b), Sox9 (red) and transitin (green; c,d), and Sox2, PCNA and BrdU (e-l). Arrows indicate the nuclei of Müller glia and hollow arrow-heads indicate the nuclei of NIRG cells. The scale bar (50 μm) in panel d applies to a-d, and the bar in l applies to e-l. The histograms in m-o illustrate the mean (±SD; n=8) numbers of proliferating Müller glia, NIRG cells and microglia in central or peripheral regions of the retina. Significance of difference (*p<0.001, **p<0.0001) between control and treated samples from different retinal regions was determined by using an unpaired, two-tailed t-test. Abbreviations: ONL – outer nuclear layer, INL – inner nuclear layer, IPL – inner plexiform layer, GCL – ganglion cell layer
Figure 6
Figure 6
Four consecutive daily injections of FGF2 alone or the combination of IL6 and FGF2 stimulate the formation of proliferating MGPCs. Eyes were injected with BrdU/saline (control), FGF2 alone, IL6 alone or the combination of IL6 and FGF2 at P6, P7, P8 and P9, BrdU in saline at P10, and retinas harvested at P12. Micrographs of peripheral regions of retinas were obtained from eyes injected with IL6 alone (a,c) or the combination of IL6 and FGF2 (b,d). Retinal sections were immunolabeled for Nkx2.2 and Sox9 (a,b) and BrdU and Sox2 (c,d). Arrows indicate NIRG cells (Nkx2.2+ Sox2+ nuclei), small double arrow indicate proliferating microglia (BrdU alone), and hollow arrow-heads indicate proliferating Müller glia (BrdU+ Sox2+ Nkx2.2− nuclei). The calibration bar (50 μm) in d applies to a-d. The histograms in e-j illustrate the mean (+SD; n≥6) number of proliferating Müller glia, NIRG cells and microglia for the different treatment paradigms in central and peripheral regions of the reitna. Significance of difference (p<0.0001) among experimental groups was determined by using ANOVA. Significance of difference (*p<0.02, **p<0.001, ***p<0.0001) between control and the different treatment groups was determined by using post-hoc Sidak-Bonferroni corrected t-tests. Abbreviations: ONL – outer nuclear layer, INL – inner nuclear layer, IPL – inner plexiform layer, GCL – ganglion cell layer.
Figure 7
Figure 7
Microglial reactivity is stimulated by ocular punctures and injections of saline, and reactivity further increased by FGF2 and IL6. Retinal sections (immunolabeled for CD45) were obtained from eyes that were uninjected (a), or from eyes that were punctured but not injected (b), injected with saline/BrdU (c), FGF2 alone (d), IL6 alone (e), or the combination of IL6 and FGF2 (f). The scale bar (50 μm) in panel f applies to a-f. The histogram in g illustrates the mean (±SD; n=6) density sum for CD45-immunofluorescence above threshold. A Levene’s test indicated unequal variances and a Kruskal-Wallis non-parametric ANOVA indicated significant (p<0.0001) differences among groups and significant (*p<0.05) differences between groups. Abbreviations: ONL – outer nuclear layer, INL – inner nuclear layer, IPL – inner plexiform layer, GCL – ganglion cell layer.
Figure 8
Figure 8
Four consecutive daily injections of FGF2 alone fail to stimulate the proliferation of MGPCs when the microglia have been ablated. Eyes were injected with IL6 alone (control) or IL6+clodronate (treated) at P9, FGF2 + BrdU at P11, P12, P13 and P14, BrdU in saline at P15, and retinas were harvested at P17. Retinal sections were immunolabeled for CD45 (a,b) and BrdU (green) and Sox2 (red; c-f). Sections of the retina were obtained from central (a-d) and peripheral (e,f) regions of the retina. Small double-arrows indicate microglia, and hollow arrow-heads indicate the nuclei of Müller glia. The scale bar (50 μm) in panel f applies to a-f. The histogram in g illustrates the mean (±SD; n=9) number of proliferating Müller glia (Brdu+Sox2+ cells in the INL and ONL). Significance of difference (**p<0.0005) was determined by using an unpaired, two-tailed t-test.
Figure 9
Figure 9
MAPK-signaling and Pax6 expression in Müller glia is stimulated by FGF2 with and without the microglia. Eyes were uninjected (a; pERK1/2 control) or injected with IL6 alone (control) or IL6+clodronate (treated) at P9, FGF2 + BrdU at P11, P12, P13 and P14, and retinas were harvested at P15. Retinal sections were immunolabeled for Sox2 (red) and pERK1/2 (green; a-c), cFos (green; d,e), p38 MAPK (green; f.g), Pax6 (green; i-l) and Sox9 (blue; i-l). The retinas in i and j were obtained from eyes that received consecutive daily injections of saline or FGF2 from P6-P9, followed by an additional injection of BrdU in saline at P10, and tissues harvested at P12 (see the treatment paradigm for Fig. 8). Hollow arrow-heads indicate the nuclei of Müller glia. The scale bar (50 μm) in panel g applies to a-g, and the bar in l applies to i-l. The histograms in panel h illustrates the mean (±SD) area sum, intensity mean and density sum for p38 MAPK-immunofluorescence above threshold in the INL. To account for inter-individual variability we calculated the difference (tr-ctrl) between treated (IL6 + clodronate + FGF2) and control (IL6 + FGF2) retinas for each individual (n=5). Significance of difference (*p<0.05, **p<0.001) was determined by using a paired t-test.

References

    1. Ashery-Padan R, Gruss P. Pax6 lights-up the way for eye development. Curr Opin Cell Biol. 2001;13(6):706–14. - PubMed
    1. Bernardos RL, Barthel LK, Meyers JR, Raymond PA. Late-stage neuronal progenitors in the retina are radial Muller glia that function as retinal stem cells. J Neurosci. 2007;27(26):7028–40. - PMC - PubMed
    1. Dorrell MI, Friedlander M. Mechanisms of endothelial cell guidance and vascular patterning in the developing mouse retina. Prog Retin Eye Res. 2006;25(3):277–95. - PubMed
    1. Fausett BV, Gumerson JD, Goldman D. The proneural basic helix-loop-helix gene ascl1a is required for retina regeneration. J Neurosci. 2008;28(5):1109–17. - PMC - PubMed
    1. Fischer AJ. Neural regeneration in the chick retina. Prog Retin Eye Res. 2005;24(2):161–82. - PubMed

Publication types

MeSH terms