
Transcriptome and methylome profiling reveals relics of genome dominance in the mesopolyploid Brassica oleracea

Isobel A P Parkin et al. Genome Biol. .

Abstract

Background: Brassica oleracea is a valuable vegetable species that has contributed to human health and nutrition for hundreds of years and comprises multiple distinct cultivar groups with diverse morphological and phytochemical attributes. In addition to this phenotypic wealth, B. oleracea offers unique insights into polyploid evolution, as it results from multiple ancestral polyploidy events and a final Brassiceae-specific triplication event. Further, B. oleracea represents one of the diploid genomes that formed the economically important allopolyploid oilseed, Brassica napus. A deeper understanding of B. oleracea genome architecture provides a foundation for crop improvement strategies throughout the Brassica genus.

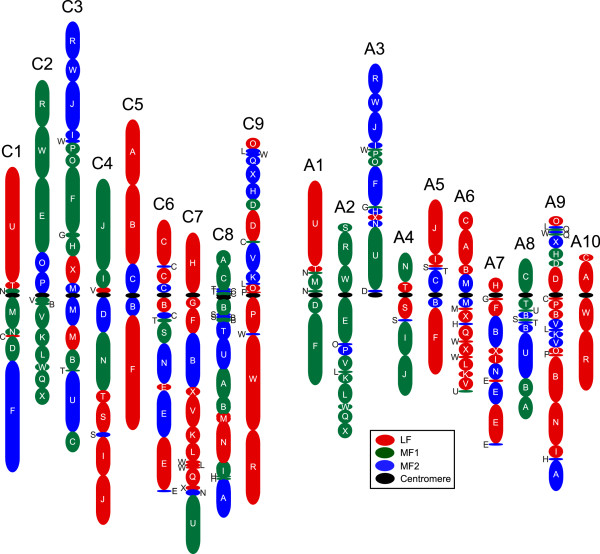
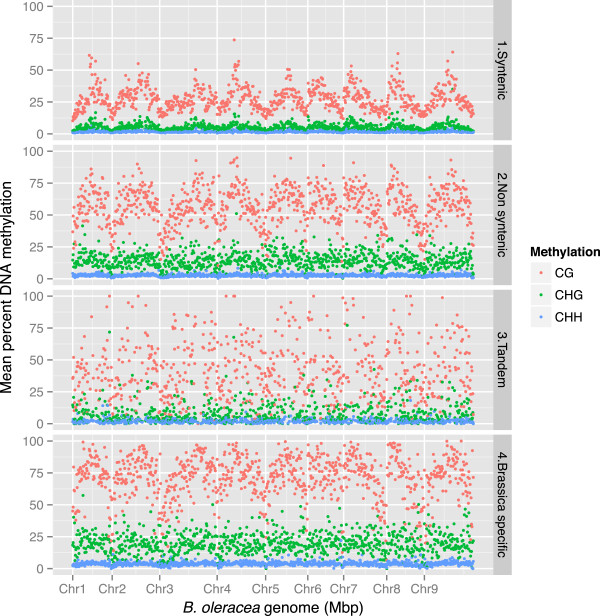
Results: We generate an assembly representing 75% of the predicted B. oleracea genome using a hybrid Illumina/Roche 454 approach. Two dense genetic maps are generated to anchor almost 92% of the assembled scaffolds to nine pseudo-chromosomes. Over 50,000 genes are annotated and 40% of the genome predicted to be repetitive, thus contributing to the increased genome size of B. oleracea compared to its close relative B. rapa. A snapshot of both the leaf transcriptome and methylome allows comparisons to be made across the triplicated sub-genomes, which resulted from the most recent Brassiceae-specific polyploidy event.

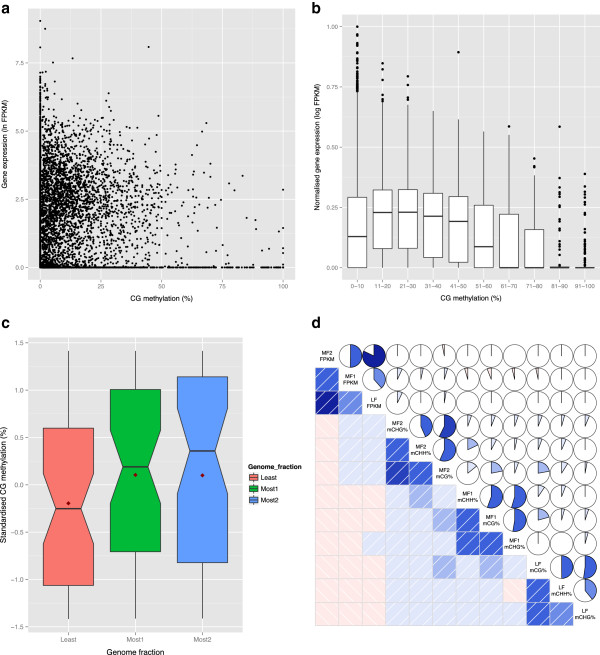
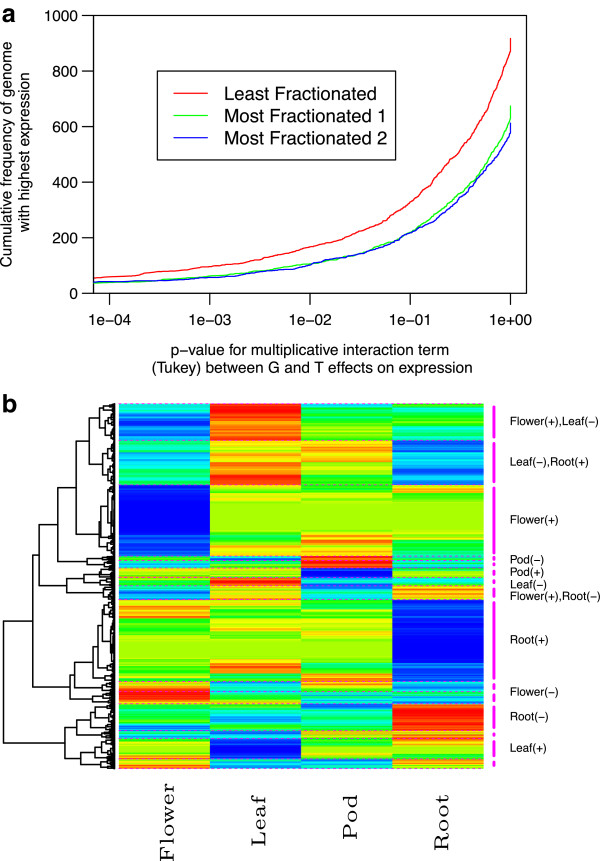
Conclusions: Differential expression of the triplicated syntelogs and cytosine methylation levels across the sub-genomes suggest residual marks of the genome dominance that led to the current genome architecture. Although cytosine methylation does not correlate with individual gene dominance, the independent methylation patterns of triplicated copies suggest epigenetic mechanisms play a role in the functional diversification of duplicate genes.


Figures

Figure 1
Figure 1
Comparison of efficacy of GBS methods. (a) Distribution of restriction sites across the B. oleracea genome, representing potential tag sites for RAD (blue) and GBS (red). (b) Observed tag coverage for restriction sites within the B. oleracea genome for RAD (blue) and GBS (red). A sliding window of 500 kb was used and the trend line is based on the mean of 10 windows.
Figure 2
Figure 2
Distribution of unique and shared gene families among Brassicaceae species. Homologous proteins in A. thaliana, A. lyrata, B. rapa and B. oleracea were clustered into gene families using TRIBE-MCL. Numbers in individual sections indicate number of gene families (not genes).
Figure 3
Figure 3
The Brassica oleracea genome. From the outside ring to the centre: 1) the nine B. oleracea pseudochromosomes (C1 to C9 represented on a Mb scale) are shown in different colors with putative centromeric regions indicated by black bands; 2) gene expression levels (average (log (FPKM)), bin = 500 kb), values range from 0 (yellow) to 3.19 (red); 3) the distribution of protein coding regions (nucleotides per 100 kb; orange) compared to repetitive sequences (nucleotides per 100 kb; yellow); 4) cytosine methylation levels (average number of methylated cytosines, bin = 500 kb) for mCG (blue), mCHG (yellow) and mCHH (grey); and 5) Ka/Ks ratios (median, bin = 500 kb) of syntenic (black) and non-syntenic (green) genes.
Figure 4
Figure 4
Alignment of the B. oleracea genome with that of B. rapa and A. thaliana. (a) Alignment with B. rapa genome; (b) alignment with A. thaliana genome. Dot-plots showing Nucmer alignments of stretches of sequence similarity between the genomes.
Figure 5
Figure 5
Derived ancestral block structure for B. oleracea and B. rapa .
Figure 6
Figure 6
Cytosine methylation levels across specific categories of genes of the B. oleracea genome. The mCG (red), mCHG (green) and mCHH (blue) levels are shown for each gene model (includes promoter regions, UTRs, exons, introns and 3′ flanking), based on a sliding window of 500 kb.
Figure 7
Figure 7
Correlation of methylation status with gene expression and genome triplication in B. oleracea. (a) Expression levels (log(FPKM)) plotted against mCG gene body methylation levels. (b) Box plot representation of different levels of mCG gene body methylation in syntenic genes (along x-axis) with normalized gene expression levels plotted on the y-axis. (c) Box plot representation of different levels of mCG observed across the three sub-genomes. (d) Correlation of gene expression (FPKM) and methylation levels among the fully retained orthologues of the three genomes. Below the diagonal, positive and negative pair-wise correlations are indicated in blue and red, respectively. Darker coloring indicates a greater magnitude for the correlation. Above the diagonal, the color and extent of the filled area of each of the pie-charts represents the strength of each pair-wise correlation. Positive and negative correlations are indicated by the pie being filled in a clockwise or anticlockwise direction, respectively.
Figure 8
Figure 8
Genome dominance and functional diversification of B. oleracea homologues retained across three sub-genomes. (a) Cumulative frequency of homologous genes belonging to the three sub-genomes with highest expression across all tissue types. P-values were calculated for interaction between sub-genomes (G) and tissue-type (T) effects on expression. (b) Hierarchical clustering of gene expression profiles for fully retained triplicated genes across four tissue types. Red and blue indicate lowest and highest expression values, respectively. Intermediate expression values follow a rainbow coloring pattern. The dotted lines to the right correspond to partitioning of the genes into 15 clusters.

References

    1. Wang X, Wang H, Wang J, Sun R, Wu J, Liu S, Bai Y, Mun JH, Bancroft I, Cheng F, Huang S, Li X, Hua W, Wang J, Wang X, Freeling M, Pires JC, Paterson AH, Chalhoub B, Wang B, Hayward A, Sharpe AG, Park BS, Weisshaar B, Liu B, Li B, Liu B, Tong C, Song C, Duran C. et al.The genome of the mesopolyploid crop species Brassica rapa. Nat Gen. 2011;43:1035–1039. - PubMed
    1. Navabi ZK, Huebert T, Sharpe AG, O’Neill CM, Bancroft I, Parkin IA. Conserved microstructure of the Brassica B Genome of Brassica nigra in relation to homologous regions of Arabidopsis thaliana, B. rapa and B. oleracea. BMC Genomics. 2013;14:250. - PMC - PubMed
    1. Leitch AR, Leitch IJ. Genomic plasticity and the diversity of polyploid plants. Science. 2008;320:481–483. - PubMed
    1. Bowers JE, Chapman BA, Rong J, Paterson AH. Unravelling angiosperm genome evolution by phylogenetic analysis of chromosomal duplication events. Nature. 2003;422:433–438. - PubMed
    1. Beilstein MA, Nagalingum NS, Clements MD, Manchester SR, Mathews S. Dated molecular phylogenies indicate a Miocene origin for Arabidopsis thaliana. Proc Natl Acad Sci U S A. 2010;107:18724–18728. - PMC - PubMed

Publication types

LinkOut - more resources