Clinical Trial
. 2014 Sep;34(9):1453-62.
doi: 10.1038/jcbfm.2014.106. Epub 2014 Jun 11.

The vascular steal phenomenon is an incomplete contributor to negative cerebrovascular reactivity in patients with symptomatic intracranial stenosis

Affiliations
Clinical Trial

The vascular steal phenomenon is an incomplete contributor to negative cerebrovascular reactivity in patients with symptomatic intracranial stenosis

Daniel F Arteaga et al. J Cereb Blood Flow Metab. 2014 Sep.

Abstract

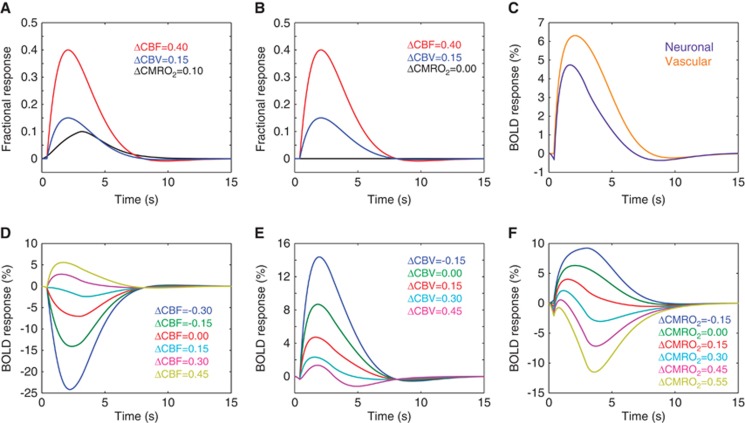
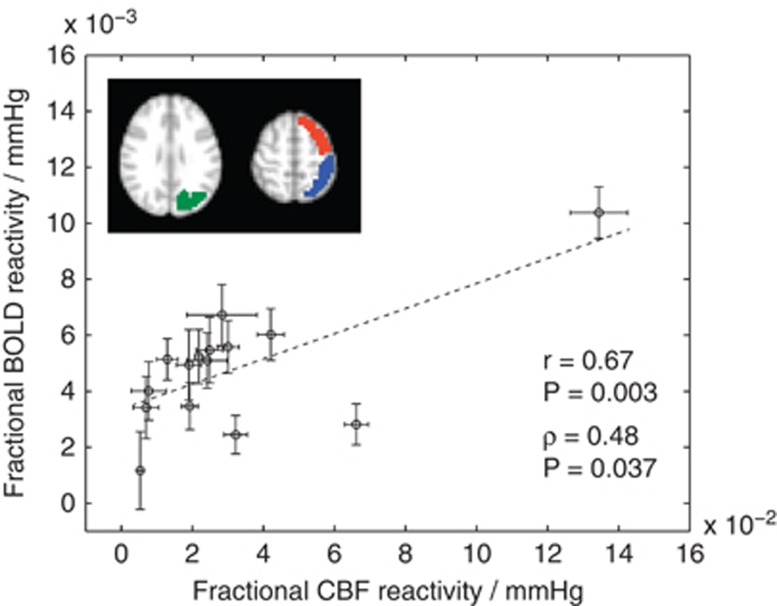
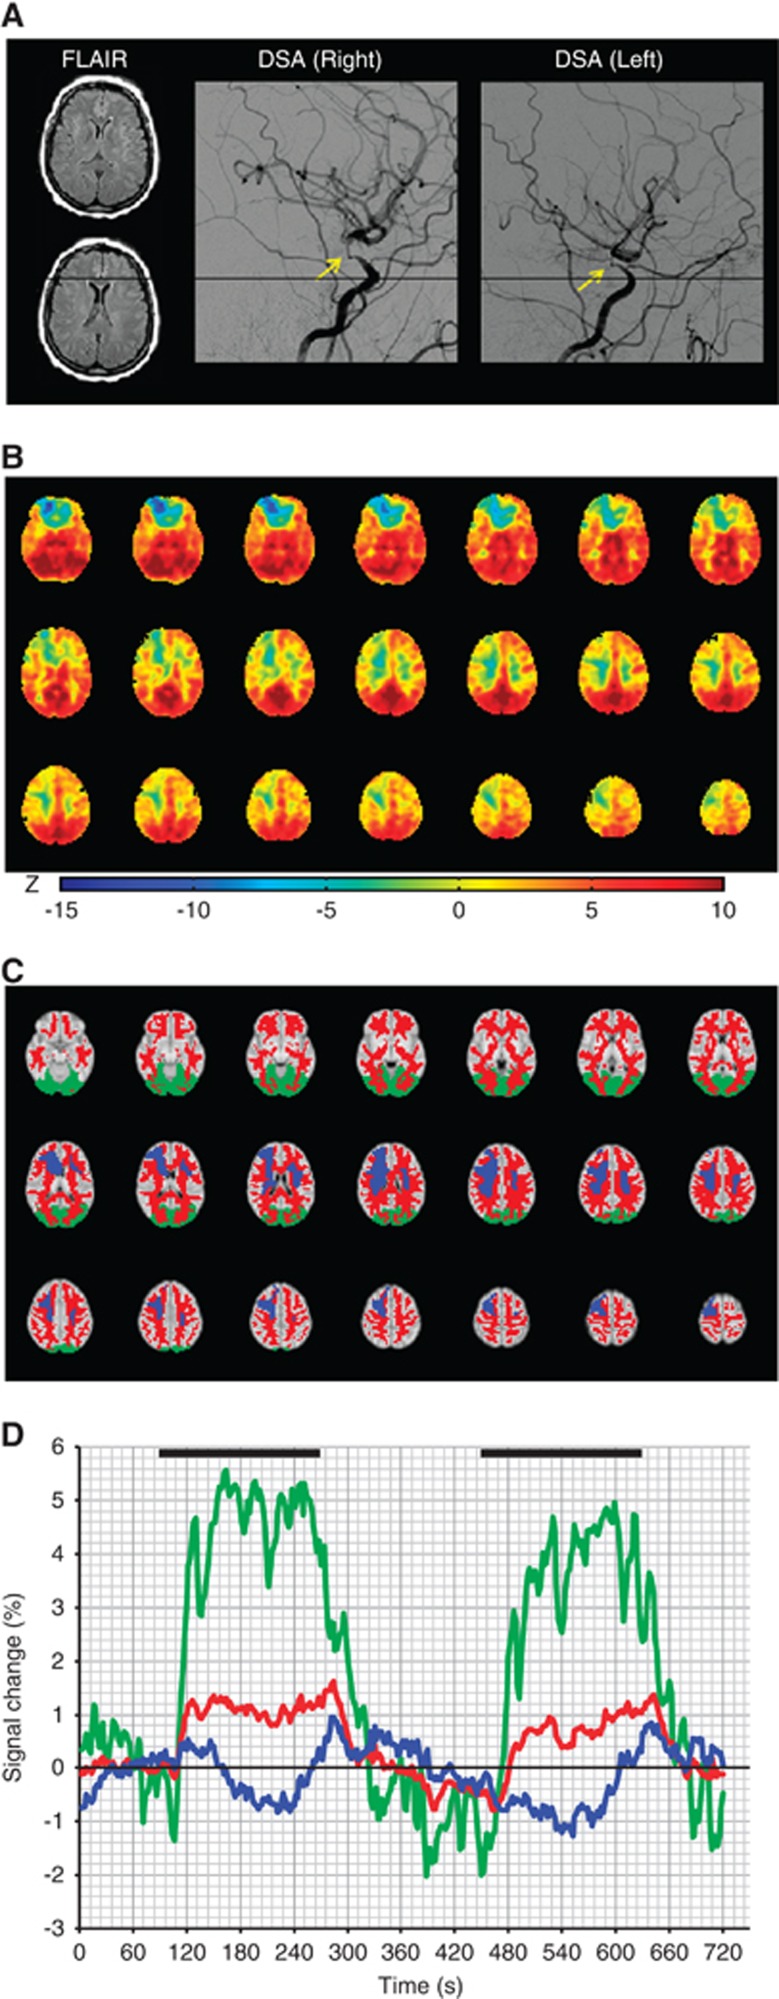
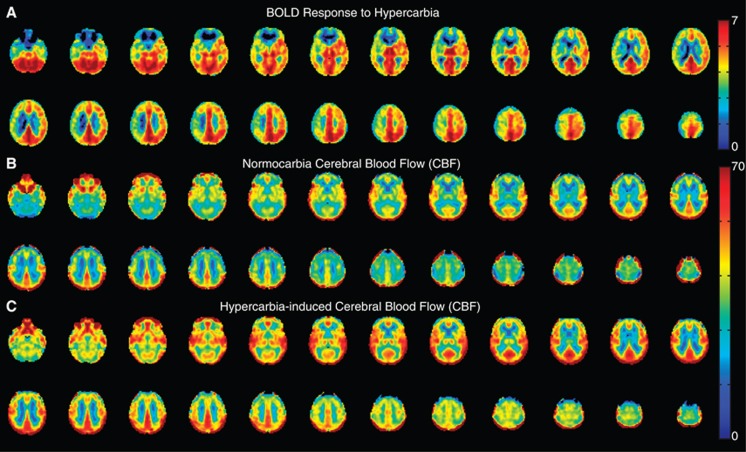
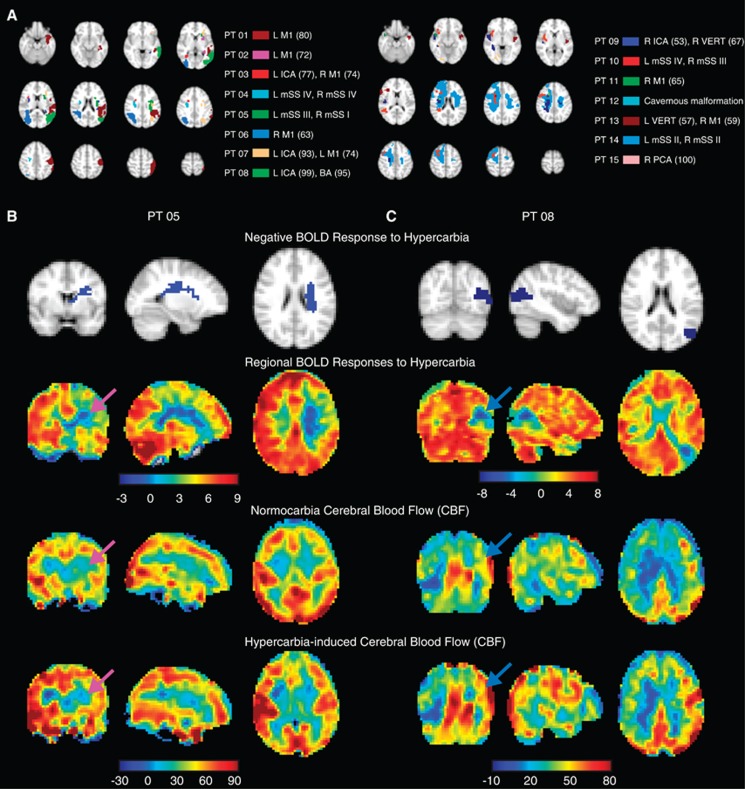
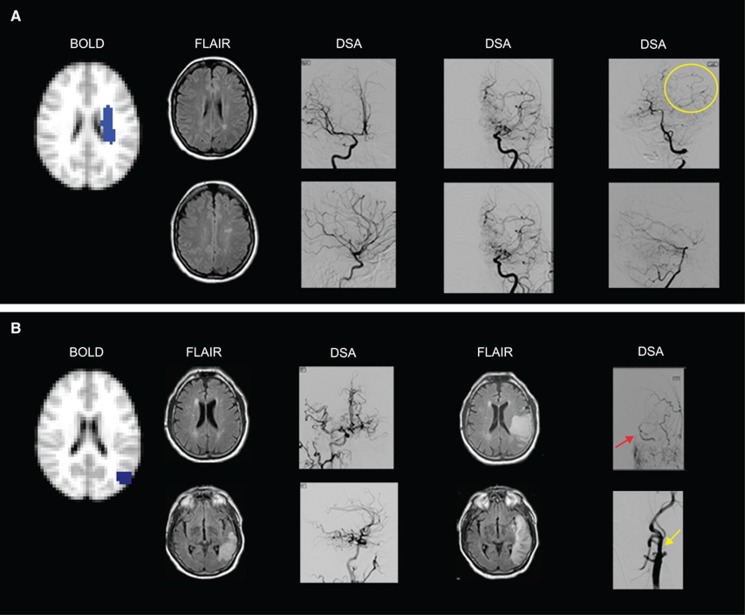
'Vascular steal' has been proposed as a compensatory mechanism in hemodynamically compromised ischemic parenchyma. Here, independent measures of cerebral blood flow (CBF) and blood oxygenation level-dependent (BOLD) magnetic resonance imaging (MRI) responses to a vascular stimulus in patients with ischemic cerebrovascular disease are recorded. Symptomatic intracranial stenosis patients (n=40) underwent a multimodal 3.0T MRI protocol including structural (T1-weighted and T2-weighted fluid-attenuated inversion recovery) and hemodynamic (BOLD and CBF-weighted arterial spin labeling) functional MRI during room air and hypercarbic gas administration. CBF changes in regions demonstrating negative BOLD reactivity were recorded, as well as clinical correlates including symptomatic hemisphere by infarct and lateralizing symptoms. Fifteen out of forty participants exhibited negative BOLD reactivity. Of these, a positive relationship was found between BOLD and CBF reactivity in unaffected (stenosis degree<50%) cortex. In negative BOLD cerebrovascular reactivity regions, three patients exhibited significant (P<0.01) reductions in CBF consistent with vascular steal; six exhibited increases in CBF; and the remaining exhibited no statistical change in CBF. Secondary findings were that negative BOLD reactivity correlated with symptomatic hemisphere by lateralizing clinical symptoms and prior infarcts(s). These data support the conclusion that negative hypercarbia-induced BOLD responses, frequently assigned to vascular steal, are heterogeneous in origin with possible contributions from autoregulation and/or metabolism.


Figures

Figure 1
Figure 1
Different physiologic responses that could contribute to negative blood oxygenation level-dependent (BOLD) responses. Simulations are based on previously published BOLD contrast models and hemodynamic response functions and are simulated for a pure gray matter voxel. Healthy (A) neuronal and (B) isometabolic (CMRO2) vascular reactivity elicit (C) different BOLD responses. The magnitude of the BOLD response depends on the balance of these changes (approximate responses at 3.0T shown), and it is not necessarily expected that cerebral blood flow (CBF) and volume (CBV) increase by the same fractional amount in response to neuronal and vascular stimuli. Additional physiologic scenarios are simulated below. Simulated BOLD responses to vascular stimulation for (D) varying CBF reactivity (ΔCBF) assuming fractional ΔCBV=0.15 and ΔCMRO2=0, (E) varying CBV reactivity (ΔCBV) assuming fractional ΔCBF=0.40 and ΔCMRO2=0, and (F) varying CMRO2 reactivity (ΔCMRO2) for fractional ΔCBF=0.40 and ΔCBV=0.15. The range of changes is for exemplar purposes only and actual values will vary with disease and region considered. These curves demonstrate how (D) vascular steal (e.g., ΔCBF<0), autoregulation (e.g., ΔCBV≥ΔCBF), and CMRO2 upregulation (e.g., ΔCMRO2>0) could elicit negative BOLD responses.
Figure 2
Figure 2
The relationship between blood oxygenation level-dependent (BOLD) and cerebral blood flow (CBF) response to hypercarbic hyperoxia (i.e., carbogen) in healthy appearing tissue (hemispheres with stenosis >50% oriented as radiologic right). Frontal (red), parietal (blue), and occipital (green) cortex regions used in the mask are shown (all voxels in all regions shown in scatter plot); regions of interest (ROIs) were based on the Harvard/Oxford cortical atlas but modified to exclude voxels that partial volume substantially with dural sinuses. This additional step was performed so that veins that are not expected to contribute to cerebrovascular reactivity but may be influenced substantially by hyperoxia are not considered. The scatter plot shows the fractional BOLD reactivity (ΔS/S0) and CBF reactivity (ΔCBF/CBF0) normalized by the change in end-tidal CO2 (mm Hg). Error bars represent s.e. over the ROI, and therefore represent variability because of measurement inaccuracy, partial voluming, and physiology. The correlations between these two metrics were significant (Pearson's R and Spearman's ρ shown).
Figure 3
Figure 3
Time-course dynamics and cerebrovascular reactivity in patient 14, a 51–year-old female with bilateral moyamoya disease. (A) Axial fluid-attenuated inversion recovery (FLAIR) appears unremarkable at the level of negative blood oxygenation level-dependent (BOLD) reactivity. Lateral projections from common carotid artery injections from digital subtraction angiography (DSA) show severe right and left stenosis. (B) BOLD z-statistic maps show positive reactivity (z-statistic>0) throughout most of the cortex, but focal negative reactivity in the right frontal lobe (z-statistic<0). (C) Anatomic atlases for the white matter (red) and occipital lobe (green) were applied, together with the negative mask (blue) to calculate (D) the temporal dynamics of the BOLD response during normo- and hypercarbia. The focus of this work was to identify the directionality of blood flow responses in regions of such negative BOLD reactivity.
Figure 4
Figure 4
Mean blood oxygenation level-dependent (BOLD) and cerebral blood flow (CBF)-weighted arterial spin labeling (ASL) responses to hypercarbia in all participants (n=15) exhibiting negative BOLD regions. Data have been co-registered to a 4 mm atlas and grouped such that radiologic right is the side of maximum stenosis or most severe moyamoya disease. Clear asymmetry is seen in the BOLD reactivity maps. While the axial CBF maps clearly increase with hypercarbia, asymmetry is less obvious, suggesting more complex mechanisms underlying the BOLD reactivity maps than can be explained by CBF-weighted ASL alone. The lower asymmetry in the CBF maps could also be because of a difference in bolus arrival time of healthy and ischemic tissue.
Figure 5
Figure 5
(A) Locations of negative blood oxygenation level-dependent (BOLD) reactivity in the 15 patients exhibiting negative BOLD effects. The 4 mm axial maps have been subdivided into two images for clarity. Example cases of a participant with (B; patient 5) and without (C; patient 8) apparent vascular intracerebral steal. Orthogonal slices of the negative BOLD reactivity regions (blue) are shown on top, followed by BOLD reactivity maps and baseline and hypercarbia-induced cerebral blood flow (CBF) maps below. The arrows identify the regions of negative BOLD reactivity. In these regions, clear and significant (P<0.01) decreases in CBF are found in patient 5, yet increases in CBF are observed in patient 8. These findings suggest that the origins of negative BOLD reactivity cannot be solely attributable to vascular intracerebral steal effects. Findings are compared with angiography in Figure 6. ICA, internal carotid artery; mSS, modified Suzuki score; PCA, posterior cerebral artery.
Figure 6
Figure 6
(A) Negative cerebrovascular reactivity (CVR) as a result of vascular steal is seen in the left centrum semiovale of a 25–year-old female with moyamoya disease. Fluid-attenuated inversion recovery (FLAIR) images show remote infarcts in the watershed distribution of the left hemisphere. Anterior–posterior (AP) and lateral projections from digital subtraction angiography (DSA) performed 1 week before hemodynamic magnetic resonance imaging (MRI) show (left DSA image) mild stenosis around the carotid bifurcation with slightly developed internal carotid artery (ICA) moyamoya (modified Suzuki score, mSS I) on the right after right ICA injection, (middle DSA image) occlusion of both the anterior cerebral artery and middle cerebral artery with well-developed ICA moyamoya (mSS III) on left external carotid artery (ECA) injection, and (right DSA image) extensive leptomeningeal collaterals from the posterior circulation to the anterior circulation upon left vertebral injection (yellow circle). (B) Negative CVR with increased cerebral blood flow in the left parietal cortex in a 72-year-old male with atherosclerotic intracranial disease. Fluid-attenuated inversion recovery images (left FLAIR image) at the time of hemodynamic MRI show a left posterior temporal–occipital infarct inferior to the region with negative reactivity (participant presented with acute aphasia 2 days before hemodynamic MRI). Anterior–posterior and lateral projection from DSA after right common carotid artery (CCA) injection shows (left DSA image) extensive cross-filling of the left cerebral hemisphere via the anterior communicating artery. Eight days later, FLAIR images (right FLAIR image) from a second MRI show the progression of the infarct to the region of negative CVR. The participant's aphasia had worsened with stroke extension that occurred when his blood pressure fell at a rehabilitation facility, 4 days after hemodynamic MRI. Anterior–posterior projections from left CCA injections show (right DSA image) collateral flow from the ECA to the intracranial ICA (red arrow) distal to the occluded cervical ICA stump (yellow arrow).

References

    1. Famakin BM, Chimowitz MI, Lynn MJ, Stern BJ, George MG. Causes and severity of ischemic stroke in patients with symptomatic intracranial arterial stenosis. Stroke. 2009;40:1999–2003. - PMC - PubMed
    1. Derdeyn CP, Chimowitz MI, Lynn MJ, Fiorella D, Turan TN, Janis LS, et al. Aggressive medical treatment with or without stenting in high-risk patients with intracranial artery stenosis (SAMMPRIS): the final results of a randomised trial. Lancet. 2014;383:333–341. - PMC - PubMed
    1. Markus H, Cullinane M. Severely impaired cerebrovascular reactivity predicts stroke and TIA risk in patients with carotid artery stenosis and occlusion. Brain. 2001;124 (Pt 3:457–467. - PubMed
    1. Zaca D, Hua J, Pillai JJ. Cerebrovascular reactivity mapping for brain tumor presurgical planning. World J Clin Oncol. 2011;2:289–298. - PMC - PubMed
    1. Gao YZ, Zhang JJ, Liu H, Wu GY, Xiong L, Shu M. Regional cerebral blood flow and cerebrovascular reactivity in Alzheimer's disease and vascular dementia assessed by arterial spinlabeling magnetic resonance imaging. Curr Neurovasc Res. 2013;10:49–53. - PubMed

Publication types

LinkOut - more resources