. 2014 Jun;141(12):2429-40.
doi: 10.1242/dev.105346.

Stochastic specification of primordial germ cells from mesoderm precursors in axolotl embryos

Affiliations

Stochastic specification of primordial germ cells from mesoderm precursors in axolotl embryos

Jodie Chatfield et al. Development. 2014 Jun.

Abstract

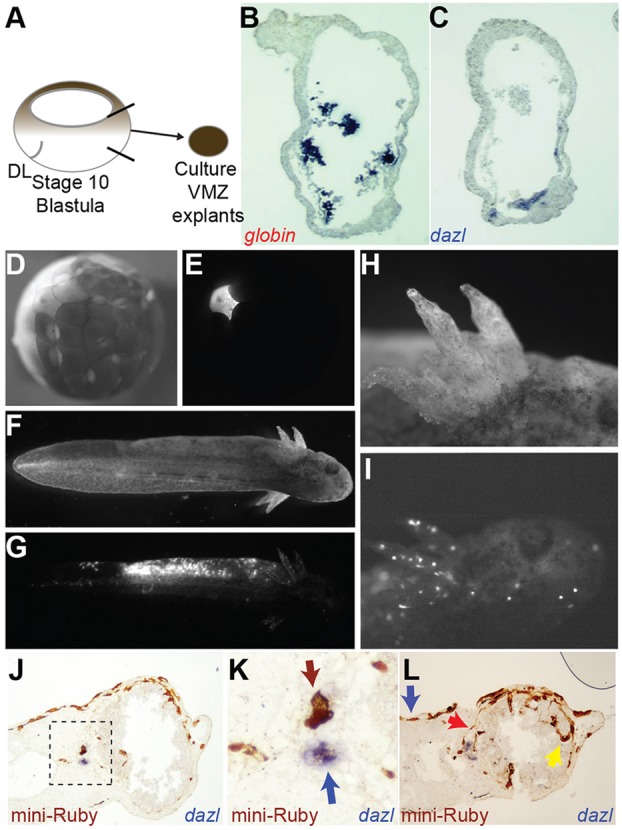
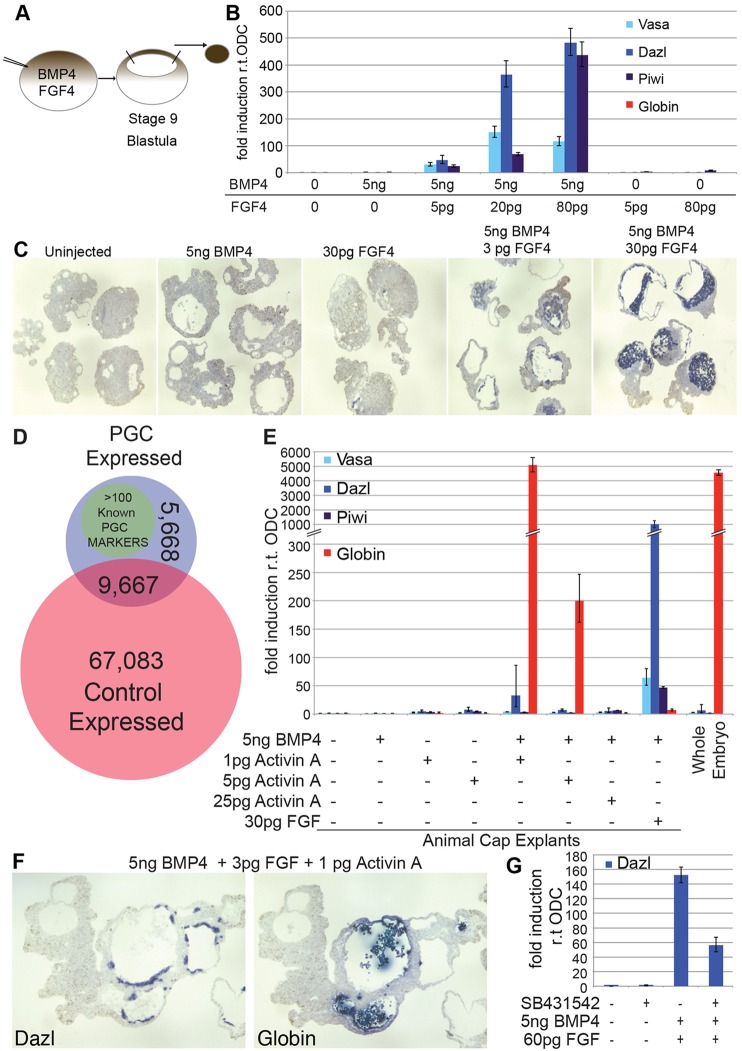
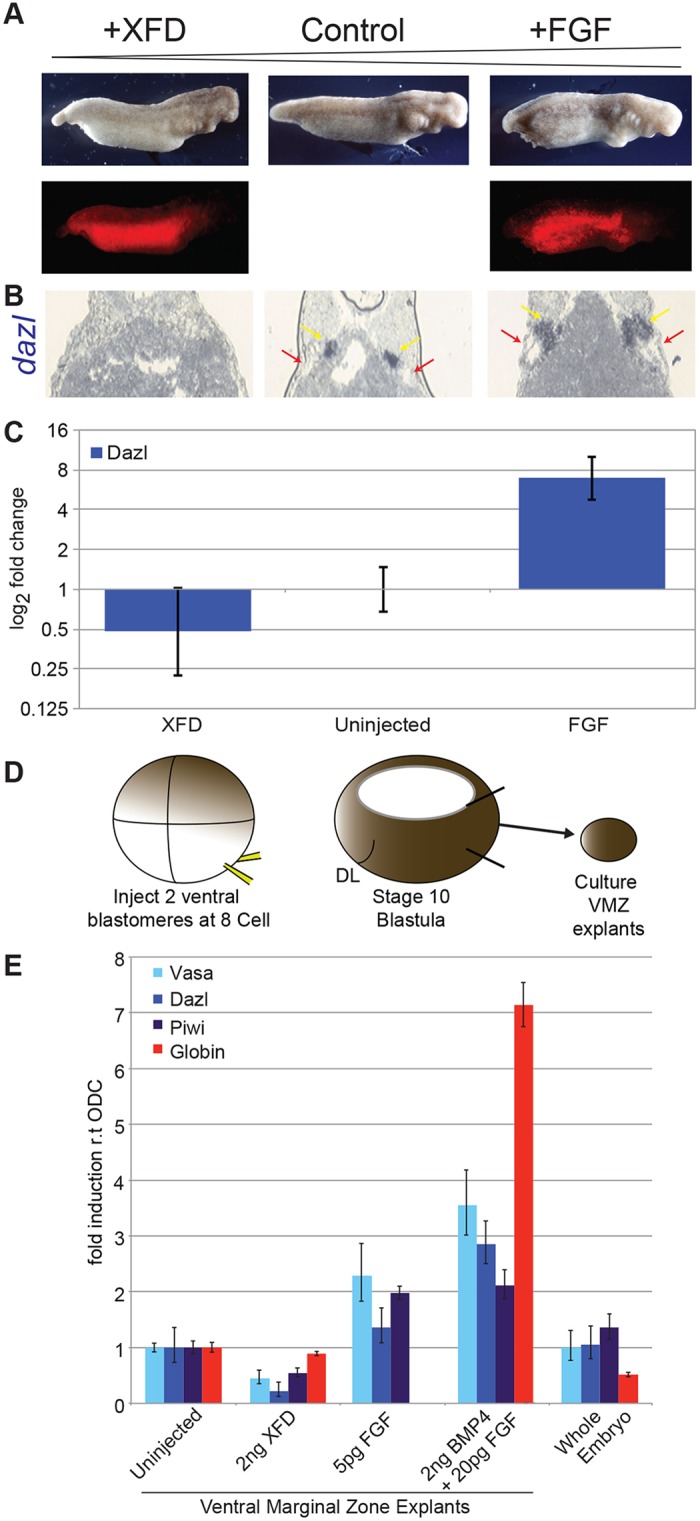
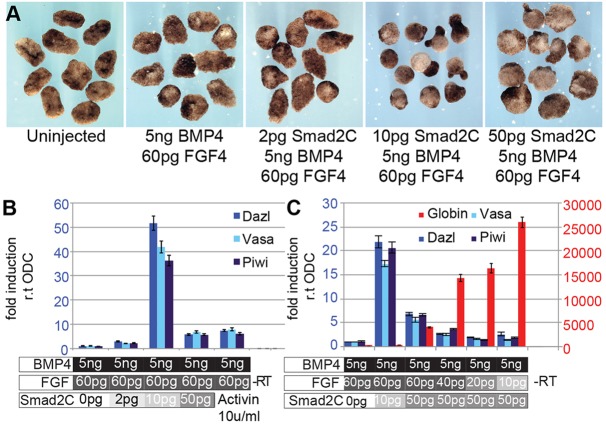
A common feature of development in most vertebrate models is the early segregation of the germ line from the soma. For example, in Xenopus and zebrafish embryos primordial germ cells (PGCs) are specified by germ plasm that is inherited from the egg; in mice, Blimp1 expression in the epiblast mediates the commitment of cells to the germ line. How these disparate mechanisms of PGC specification evolved is unknown. Here, in order to identify the ancestral mechanism of PGC specification in vertebrates, we studied PGC specification in embryos from the axolotl (Mexican salamander), a model for the tetrapod ancestor. In the axolotl, PGCs develop within mesoderm, and classic studies have reported their induction from primitive ectoderm (animal cap). We used an axolotl animal cap system to demonstrate that signalling through FGF and BMP4 induces PGCs. The role of FGF was then confirmed in vivo. We also showed PGC induction by Brachyury, in the presence of BMP4. These conditions induced pluripotent mesodermal precursors that give rise to a variety of somatic cell types, in addition to PGCs. Irreversible restriction of the germ line did not occur until the mid-tailbud stage, days after the somatic germ layers are established. Before this, germline potential was maintained by MAP kinase signalling. We propose that this stochastic mechanism of PGC specification, from mesodermal precursors, is conserved in vertebrates.

Keywords: Axolotl; Evolution; Germ plasm; Mesoderm; PGC; Pluripotency; Primordial germ cell.


Figures

Fig. 1.
Fig. 1.
PGCs develop from pluripotent cells in the VMZ. (A) Schematic showing the isolation of VMZ explants. DL, dorsal lip of the blastopore. Black lines on ventral side show approximate area of dissection. (B,C) ISH (purple) in sections of the same explant shows expression of globin (B) and dazl (C). (D) A single blastomere of a 128-cell embryo that had been injected with mini-Ruby shown under bright light. Ventral is to the left. (E) The same embryo as that in D shown under UV light to show labelling of a single blastomere. (F) Bright field view of an embryo at stage 42. (G) Under UV light, the embryo shows labelling by mini-Ruby in lateral mesoderm. (H) View of gills from an injected embryo under bright light. (I) UV light shows blood cells circulating through the gills. (J) Mid-trunk section of an embryo, stained to detect horseradish peroxidase activity of mini-Ruby (brown) and ISH for dazl RNA (purple). (K) Close-up of the boxed section in J shows a labelled PGC cluster stained for mini-Ruby HRP activity (brown) from the injected side of embryo (top, brown arrow). ISH for dazl (purple) detects a PGC cluster from the uninjected side of the embryo (bottom, blue arrow). (L) A section from further towards the anterior of the same embryo as that shown in K shows mini-Ruby labelling in ectoderm (blue arrow), mesoderm (red arrow) and endoderm (yellow arrow).
Fig. 2.
Fig. 2.
Ectopic induction of PGCs by FGF and BMP4. (A) Scheme for PGC in animal cap explants. (B) qRT-PCR analysis of PGC (dazl, vasa, piwi) and blood (globin) markers in animal caps that expressed FGF and BMP4. The data were normalised to expression of ornithine decarboxylase. Means±95% CI are shown. (C) ISH to detect dazl (purple) in animal caps after injection of the indicated RNAs. (D) Diagram comparing the deep sequencing of animal caps containing PGCs (blue) against that of unstimulated controls (red). (E) qRT-PCR analysis of PGC or blood markers in animal caps that expressed Activin A or FGF with BMP4. The data were normalised to ODC. Means±95% CI are shown. (F) Serial sections of a cap that had been induced with low levels of FGF and Activin A with BMP4 and probed for globin or dazl expression by using ISH. (G) qRT-PCR analysis of dazl expression in caps that had been induced with FGF and BMP4 in the presence or absence of SB431542. The data were normalised to ODC. Means±95% CI are shown.
Fig. 3.
Fig. 3.
FGF regulates PGC induction in vivo. (A) The top row of images shows the effects of FGF signalling on posterior development of the axolotl. The control was uninjected. The bottom row of images shows embryos under UV light to detect mini-Ruby. XFD, dominant-negative FGF receptor. (B) ISH to detect dazl in sections from embryos as described in A. Alignment of the images also corresponds to the labelling in A. Mesonephric ducts are indicted by red arrows, PGCs by yellow arrows. (C) qRT-PCR analysis of dazl expression in whole embryos with altered FGF signalling. The fold-change relative to uninjected controls is shown. Means±95% CI are shown. (D) Scheme for isolation of VMZ explants. DL, dorsal lip of the blastopore. (E) qRT-PCR analysis of PGC and blood marker expression in embryos, or explants from embryos that had been treated as indicated. Data were normalised to ODC. Means±95% CI are shown.
Fig. 4.
Fig. 4.
Ectopic induction of PGCs by FGF and SMAD2. (A) Morphology of animal caps expressing FGF and constitutively active Smad2 (Smad2C) with BMP4. (B) qRT-PCR analysis showed that a low level of Smad2C RNA enhances PGC induction by FGF. Data were normalised to the expression in caps that had been injected with RNA encoding FGF and BMP4. Means±95% CI are shown. (C) qRT-PCR analysis to detect PGC or blood markers in response to titration of FGF and Smad2C in the presence of a constant amount of RNA encoding BMP4. The numbers in red on the right-hand side of the graph show the fold-change in globin expression. Means±95% CI are shown. –RT, no reverse transcriptase.
Fig. 5.
Fig. 5.
Induction of PGCs by Brachyury. (A) qRT-PCR analysis of gene expression in caps that had been programmed with a constant amount of FGF and BMP4, with Smad2C or increasing amounts of Brachyury (Bra). Scales are at different levels; blue scale is PGC markers, red is globin. (B) qRT-PCR analysis of dazl expression in caps that had been programmed with constant levels of Brachyury and BMP4 with increasing levels of FGF. (C) qRT-PCR of dazl and ncam expression in caps expressing Brachyury and BMP4 after timed addition of SU5402 [stage (st) 9, 11, 13 or 20]. (D) qRT-PCR of AGM markers from the same caps as those used in C. All qRT-PCR data were normalised to ODC. –RT, no reverse transcriptase. Means±95% CI are shown. (E) ISH to detect dazl RNA (purple) in caps that had been induced with Brachyury and BMP4, or in caps from uninjected embryos. Note the vesicle from dazl-negative cells (arrow). (F) ISH to detect ncam RNA (purple) in caps prepared as described in E.
Fig. 6.
Fig. 6.
Mix redirects specified PGC precursors to somatic development. (A) qRT-PCR analysis of markers for PGCs or somatic cells in caps that had been programmed with Brachyury (Bra) and BMP4 and increasing levels of Mix. The y-axis scales are at different levels. The red scale is for globin. (B) The morphology of caps in response to Mix. (C) qRT-PCR analysis of PGC and somatic markers after timed activation of Mix-GR-HA (Mix::GR) in caps that had been programmed by Brachyury and BMP4. Dex, dexamethasone. (D) qRT-PCR analysis of the response of AGM markers to Mix. St, stage. For all qRT-PCR data, Means±95% CI are shown. (E) Western blot analysis to detect the Mix-GR-HA fusion protein in staged caps by using an antibody against HA. (F) Experimental design of ventral Mix induction as shown in G-J. Embryos were injected at the VMZ with RNA encoding Mix-GR-HA and mini-Ruby; Dex was administered at specific time points. (G) Embryos that had been injected with the indicated RNAs were examined at the neurula stage under bright-field (left) or UV (right) conditions. (H) Embryos from G at the tailbud stage under a bright field (left) or UV (right). (I) ISH for dazl RNA (purple) in stage-45 control embryos, or after Mix-GR-HA had been activated at stage 14. Yellow arrows indicate PGCs. (J) H&E-stained sections of embryos that had been treated as described in H. PGCs are indicated by yellow arrows. Purple arrows indicate mesonephric ducts.
Fig. 7.
Fig. 7.
MAPK signalling is required for PGC development. (A) Embryos at stage 30 after treatment with UO126 (100 μM) or LY294002 (50 μM) during gastrula stages. (B) Morphology of caps that expressed Brachyury (Bra) and BMP4 after treatment with varying doses of UO126. Elongation is indicated by arrows. (C) qRT-PCR of PGC markers from animal caps that expressed Brachyury and BMP4 and had been treated with increasing levels of UO126. (D) Expression of AGM markers from the caps shown in C. Data were normalised to ODC. The red numbers are the fold induction of WT1. Means±95% CI are shown. (E) Top panel: stage-45 embryo after treatment with UO126 (100 μM) during gastrula stages. Middle panel: H&E-stained section of AGM from an untreated stage-45 embryo. PGCs have darkly stained nuclei and are indicated by blue arrows. Mesonephric ducts are indicated by yellow arrows and the dorsal aorta by the red arrow. Bottom panel: section of AGM from a stage-45 embryo that had been treated with UO126 (100 μM) during gastrula stages. In the middle and bottom rows, the image on the right is an enlarged section of that shown on the left. (F) Model for mesoderm patterning in the VMZ. FGF is activated downstream of Brachyury. PI3K promotes mesoderm development. MAPK signalling inhibits mesoderm differentiation to promote the development of PGCs.

References

    1. Ahlberg P. E., Clack J. A., Blom H. (2005). The axial skeleton of the Devonian tetrapod Ichthyostega. Nature 437, 137-140 10.1038/nature03893 - DOI - PubMed
    1. Amaya E., Musci T. J., Kirschner M. W. (1991). Expression of a dominant negative mutant of the FGF receptor disrupts mesoderm formation in Xenopus embryos. Cell 66, 257-270 10.1016/0092-8674(91)90616-7 - DOI - PubMed
    1. Anderson J. S., Reisz R. R., Scott D., Fröbisch N. B., Sumida S. S. (2008). A stem batrachian from the Early Permian of Texas and the origin of frogs and salamanders. Nature 453, 515-518 10.1038/nature06865 - DOI - PubMed
    1. Aramaki S., Hayashi K., Kurimoto K., Ohta H., Yabuta Y., Iwanari H., Mochizuki Y., Hamakubo T., Kato Y., Shirahige K., et al. (2013). A mesodermal factor, T, specifies mouse germ cell fate by directly activating germline determinants. Dev. Cell 27, 516-529 10.1016/j.devcel.2013.11.001 - DOI - PubMed
    1. Bachvarova R. F., Masi T., Drum M., Parker N., Mason K., Patient R., Johnson A. D. (2004). Gene expression in the axolotl germ line: Axdazl, Axvh, Axoct-4, and Axkit. Dev. Dyn. 231, 871-880 10.1002/dvdy.20195 - DOI - PubMed

Publication types