

Predictable internal brain dynamics in EEG and its relation to conscious states
- PMID: 24917813
- PMCID: PMC4043151
- DOI: 10.3389/fnbot.2014.00018
Predictable internal brain dynamics in EEG and its relation to conscious states
Abstract
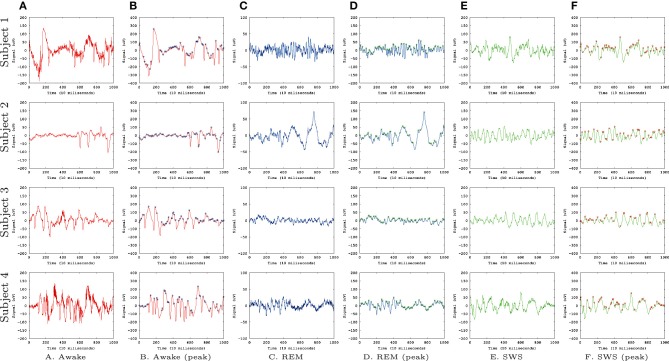
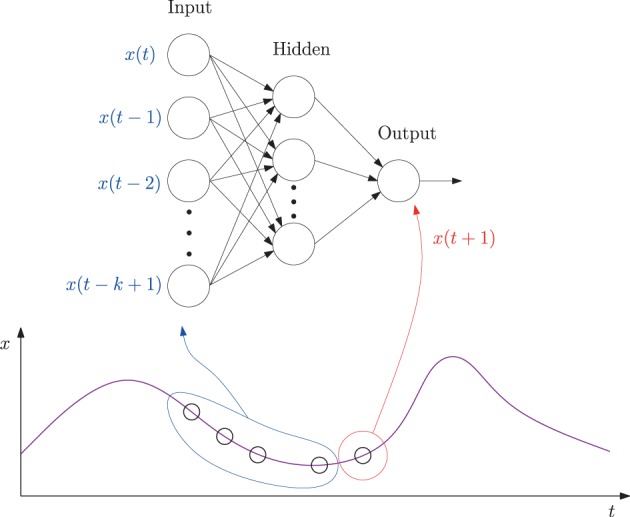
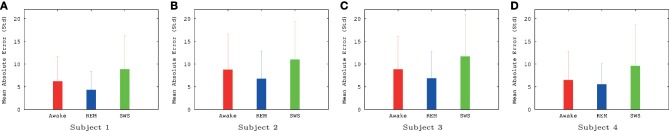
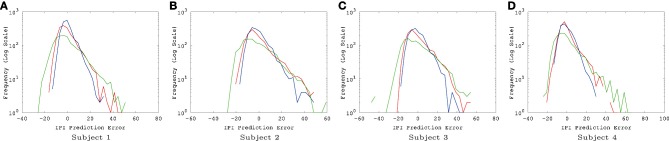
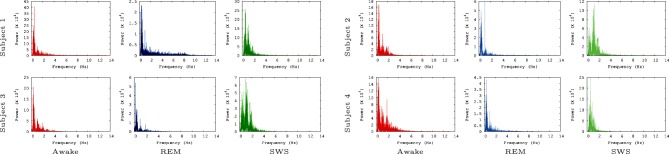
Consciousness is a complex and multi-faceted phenomenon defying scientific explanation. Part of the reason why this is the case is due to its subjective nature. In our previous computational experiments, to avoid such a subjective trap, we took a strategy to investigate objective necessary conditions of consciousness. Our basic hypothesis was that predictive internal dynamics serves as such a condition. This is in line with theories of consciousness that treat retention (memory), protention (anticipation), and primary impression as the tripartite temporal structure of consciousness. To test our hypothesis, we analyzed publicly available sleep and awake electroencephalogram (EEG) data. Our results show that EEG signals from awake or rapid eye movement (REM) sleep states have more predictable dynamics compared to those from slow-wave sleep (SWS). Since awakeness and REM sleep are associated with conscious states and SWS with unconscious or less consciousness states, these results support our hypothesis. The results suggest an intricate relationship among prediction, consciousness, and time, with potential applications to time perception and neurorobotics.
Keywords: EEG; consciousness; neuroevolution; predictable dynamics; sleep.
Figures

Similar articles
-
Consolidation of strictly episodic memories mainly requires rapid eye movement sleep.Sleep. 2004 May 1;27(3):395-401. doi: 10.1093/sleep/27.3.395. Sleep. 2004. PMID: 15164890
-
Non-REM sleep and the neural correlates of consciousness: more than meets the eyes.Arch Ital Biol. 2018 Sep 1;156(3):137-148. doi: 10.12871/00039829201835. Arch Ital Biol. 2018. PMID: 30324609 Review.
-
High-voltage, diffuse delta rhythms coincide with wakeful consciousness and complexity in Angelman syndrome.Neurosci Conscious. 2020 Jun 14;2020(1):niaa005. doi: 10.1093/nc/niaa005. eCollection 2020. Neurosci Conscious. 2020. PMID: 32551137 Free PMC article.
-
Neuronal phenomena associated with vigilance and consciousness: from cellular mechanisms to electroencephalographic patterns.Conscious Cogn. 1998 Mar;7(1):42-53. doi: 10.1006/ccog.1997.0324. Conscious Cogn. 1998. PMID: 9521831 Review.
-
Avian reflex and electroencephalogram responses in different states of consciousness.Physiol Behav. 2014 Jun 22;133:252-9. doi: 10.1016/j.physbeh.2014.05.030. Epub 2014 May 28. Physiol Behav. 2014. PMID: 24878315
Cited by
-
Eeg based smart emotion recognition using meta heuristic optimization and hybrid deep learning techniques.Sci Rep. 2024 Dec 4;14(1):30251. doi: 10.1038/s41598-024-80448-5. Sci Rep. 2024. PMID: 39632923 Free PMC article.
-
SAE+LSTM: A New Framework for Emotion Recognition From Multi-Channel EEG.Front Neurorobot. 2019 Jun 12;13:37. doi: 10.3389/fnbot.2019.00037. eCollection 2019. Front Neurorobot. 2019. PMID: 31244638 Free PMC article.
-
Hybrid EEG-fNIRS-Based Eight-Command Decoding for BCI: Application to Quadcopter Control.Front Neurorobot. 2017 Feb 17;11:6. doi: 10.3389/fnbot.2017.00006. eCollection 2017. Front Neurorobot. 2017. PMID: 28261084 Free PMC article.
-
Toward embodied artificial cognition: TIME is on my side.Front Neurorobot. 2014 Dec 8;8:25. doi: 10.3389/fnbot.2014.00025. eCollection 2014. Front Neurorobot. 2014. PMID: 25538614 Free PMC article. No abstract available.
References
-
- Berger H. (1929). Über das elektrenkephalogramm des menschen. Eur. Arch. Psychiatry Clin. Neurosci. 87, 527–570
LinkOut - more resources
Full Text Sources
Other Literature Sources