

The buffer capacity of airway epithelial secretions
- PMID: 24917822
- PMCID: PMC4042063
- DOI: 10.3389/fphys.2014.00188
The buffer capacity of airway epithelial secretions
Abstract
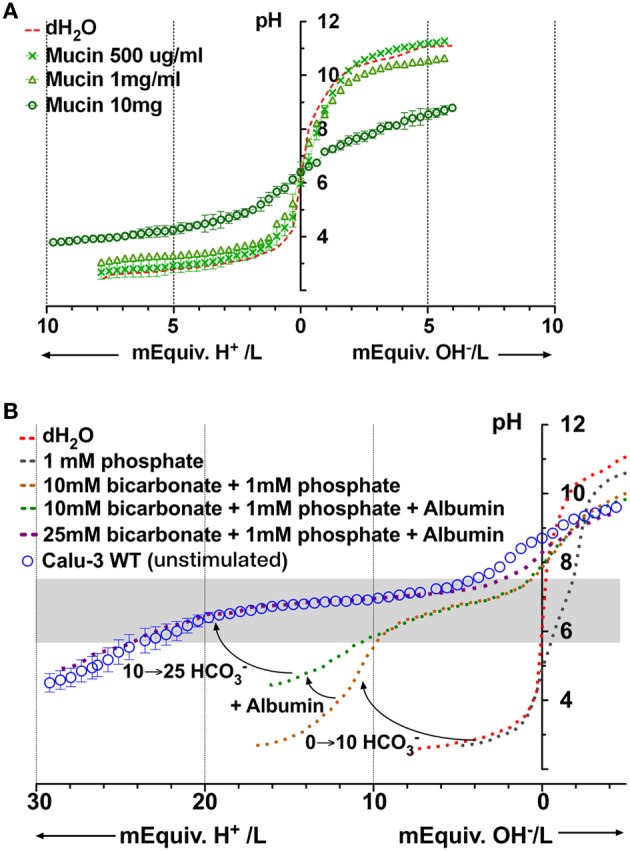
The pH of airway epithelial secretions influences bacterial killing and mucus properties and is reduced by acidic pollutants, gastric reflux, and respiratory diseases such as cystic fibrosis (CF). The effect of acute acid loads depends on buffer capacity, however the buffering of airway secretions has not been well characterized. In this work we develop a method for titrating micro-scale (30 μl) volumes and use it to study fluid secreted by the human airway epithelial cell line Calu-3, a widely used model for submucosal gland serous cells. Microtitration curves revealed that HCO(-) 3 is the major buffer. Peak buffer capacity (β) increased from 17 to 28 mM/pH during forskolin stimulation, and was reduced by >50% in fluid secreted by cystic fibrosis transmembrane conductance regulator (CFTR)-deficient Calu-3 monolayers, confirming an important role of CFTR in HCO(-) 3 secretion. Back-titration with NaOH revealed non-volatile buffer capacity due to proteins synthesized and released by the epithelial cells. Lysozyme and mucin concentrations were too low to buffer Calu-3 fluid significantly, however model titrations of porcine gastric mucins at concentrations near the sol-gel transition suggest that mucins may contribute to the buffer capacity of ASL in vivo. We conclude that CFTR-dependent HCO(-) 3 secretion and epithelially-derived proteins are the predominant buffers in Calu-3 secretions.
Keywords: CFTR; airway submucosal glands; bicarbonate secretion; cystic fibrosis.
Figures


 ) macrotitration of the same solution performed in a closed under paraffin oil. Also shown is a titration curve for water titrated with NaOH in an open system (
 , i.e., vigorously bubbled with air). The microtitration results resemble those obtained by macrotitration under paraffin oil (i.e., a closed system). (D) equilibrium buffer capacity calculated over a similar pH range from macroscopic titrations under open (, bubbled with air) vs. closed conditions (, under paraffin oil).
 , treated with DMSO vehicle) and during stimulation by 10 μM forskolin (
 ). Dotted line shows the control curve obtained with distilled water. HCl and NaOH were the titrants and were added in increments of 0.4 mM final concentration. Means ± SD, n = 4–5. (B,C) Mean buffer capacity β for fluid from unstimulated (DMSO) and forskolin (FSK) stimulated Calu-3 secretions, respectively, calculated from (A). (D) Effect of CFTR knockdown on the titration curves obtained under basal conditions (DMSO) and during forskolin stimulation (FSK). Curved arrows show the impact of CFTR on buffering of Calu-3 secretions.
 ) and back (
 ) titrations. Means ± SD; n = 3–5.

Similar articles
-
HCO3- transport in relation to mucus secretion from submucosal glands.JOP. 2001 Jul;2(4 Suppl):280-4. JOP. 2001. PMID: 11875272 Review.
-
Bicarbonate-dependent chloride transport drives fluid secretion by the human airway epithelial cell line Calu-3.J Physiol. 2012 Nov 1;590(21):5273-97. doi: 10.1113/jphysiol.2012.236893. Epub 2012 Jul 9. J Physiol. 2012. PMID: 22777674 Free PMC article.
-
Novel role for pendrin in orchestrating bicarbonate secretion in cystic fibrosis transmembrane conductance regulator (CFTR)-expressing airway serous cells.J Biol Chem. 2011 Nov 25;286(47):41069-82. doi: 10.1074/jbc.M111.266734. Epub 2011 Sep 13. J Biol Chem. 2011. PMID: 21914796 Free PMC article.
-
Bicarbonate and chloride secretion in Calu-3 human airway epithelial cells.J Gen Physiol. 1999 May;113(5):743-60. doi: 10.1085/jgp.113.5.743. J Gen Physiol. 1999. PMID: 10228185 Free PMC article.
-
Anion secretion by a model epithelium: more lessons from Calu-3.Acta Physiol (Oxf). 2011 Jul;202(3):523-31. doi: 10.1111/j.1748-1716.2011.02253.x. Epub 2011 Mar 22. Acta Physiol (Oxf). 2011. PMID: 21251238 Review.
Cited by
-
Fluid transport by the cornea endothelium is dependent on buffering lactic acid efflux.Am J Physiol Cell Physiol. 2016 Jul 1;311(1):C116-26. doi: 10.1152/ajpcell.00095.2016. Epub 2016 May 25. Am J Physiol Cell Physiol. 2016. PMID: 27225657 Free PMC article.
-
Measuring pH and Buffer Capacity in Fluids Aspirated from the Fasted Upper Gastrointestinal Tract of Healthy Adults.Pharm Res. 2020 Jan 27;37(3):42. doi: 10.1007/s11095-019-2731-3. Pharm Res. 2020. PMID: 31989335
-
Simulation of Cl(-) Secretion in Epithelial Tissues: New Methodology Estimating Activity of Electro-Neutral Cl(-) Transporter.Front Physiol. 2015 Dec 23;6:370. doi: 10.3389/fphys.2015.00370. eCollection 2015. Front Physiol. 2015. PMID: 26779025 Free PMC article.
-
Bicarbonate Effects on Antibacterial Immunity and Mucus Glycobiology in the Cystic Fibrosis Lung: A Review With Selected Experimental Observations.Infect Microbes Dis. 2022 Sep;4(3):103-110. doi: 10.1097/im9.0000000000000101. Epub 2022 Aug 16. Infect Microbes Dis. 2022. PMID: 36793929 Free PMC article.
-
Targeting ATP12A, a Nongastric Proton Pump α Subunit, for Idiopathic Pulmonary Fibrosis Treatment.Am J Respir Cell Mol Biol. 2023 Jun;68(6):638-650. doi: 10.1165/rcmb.2022-0264OC. Am J Respir Cell Mol Biol. 2023. PMID: 36780662 Free PMC article.
References
LinkOut - more resources
Full Text Sources
Other Literature Sources