Review
. 2014 Jun 2:5:162.
doi: 10.3389/fgene.2014.00162. eCollection 2014.

Genetic-based prediction of disease traits: prediction is very difficult, especially about the future

Affiliations
Review

Genetic-based prediction of disease traits: prediction is very difficult, especially about the future

Steven J Schrodi et al. Front Genet. .

Abstract

Translation of results from genetic findings to inform medical practice is a highly anticipated goal of human genetics. The aim of this paper is to review and discuss the role of genetics in medically-relevant prediction. Germline genetics presages disease onset and therefore can contribute prognostic signals that augment laboratory tests and clinical features. As such, the impact of genetic-based predictive models on clinical decisions and therapy choice could be profound. However, given that (i) medical traits result from a complex interplay between genetic and environmental factors, (ii) the underlying genetic architectures for susceptibility to common diseases are not well-understood, and (iii) replicable susceptibility alleles, in combination, account for only a moderate amount of disease heritability, there are substantial challenges to constructing and implementing genetic risk prediction models with high utility. In spite of these challenges, concerted progress has continued in this area with an ongoing accumulation of studies that identify disease predisposing genotypes. Several statistical approaches with the aim of predicting disease have been published. Here we summarize the current state of disease susceptibility mapping and pharmacogenetics efforts for risk prediction, describe methods used to construct and evaluate genetic-based predictive models, and discuss applications.

Keywords: clinical utility; genetic risk; human genetics; predictive model; prognosis.


Figures

Figure 1
Figure 1
Rheumatoid arthritis scaled posterior probabilities (SRR). Genotype data at three strongly predisposing loci, HLA-DRB1, TRAF1, and PTPN22 are combined and the posterior probabilities calculated for every possible multilocus genotype combination. The prior probability was set to the approximate population prevalence of rheumatoid arthritis, 0.01. The posterior probabilities are scaled such that the lowest RA-risk multilocus genotype was set to a value of 1. The results show a 41-fold variation in posterior probabilities. The expected frequencies of the various multilocus genotype combinations in RA patients/controls are shown at the top of each bar.
Figure 2
Figure 2
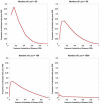
Posterior probability variation with relative risk. The density of posterior probabilities of disease (PPD) are shown under a simplified multilocus disease model. The number of independent, disease-predisposing SNPs was set at 500. Relative risk was modeled as being identical for each predisposing SNP. Frequency of the predisposing genotype in controls was set to 0.05 at each SNP. Prior probability of disease was set at 0.20. Naïve Bayes was used to calculate posterior probabilities. The data points only take on discrete values (The densities are composed of discrete values which are connected by lines to produce the curves. While the sum of the discrete values all equal one in each of the curves, the areas under the curves do not), but are presented with interconnecting lines.
Figure 3
Figure 3
Posterior probability variation with number of predisposing loci. The density of posterior probabilities of disease (PPD) is shown under a simplified multilocus disease model. The relative risk of each independent, disease-predisposing SNP was set to 2.0. Prior probability of disease was set at 0.20. Frequency of the predisposing genotype in controls was set to 0.05 at each SNP. The number of predisposing loci was increased from 20 to 1000. Naïve Bayes was used to calculate posterior probabilities. The data points only take on discrete values (the larger number of loci have many more data points reflecting the larger number of possible multilocus genotype combinations), but are presented with interconnecting lines.
Figure 4
Figure 4
AUC. The figure shows the ROC curve and corresponding area under the ROC curve (AUC). The expected patterns under two extreme scenarios are shown: an ideal diagnostic scenario and the pattern expected using random predictions.
Figure 5
Figure 5
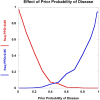
Effect of prior probability. The frequency of multilocus genotype combinations exceeding the C1 and C2 thresholds for posterior probabilities of disease (PPD) (set at 0.05 and 0.95, respectively) are presented as a function of the prior probability of disease. 100 predisposing SNPs were used in the model, each having a predisposing genotype frequency of 5% in controls and relative risk of 2.0.
Figure 6
Figure 6
Highly polygenic model. The dynamics of the C1/C2 threshold values under a simplified model is shown as the relative risk of the SNPs varies. The highly polygenic model has 1000 predisposing SNPs each having predisposing genotype frequencies in controls equal to 10% and a prior probability equal to 0.20. The relative risk was varied from 1.02 to 1.80.
Figure 7
Figure 7
Highly penetrant model. The highly penetrant model uses 100 SNPs each having a predisposing genotype frequency of 0.1% and also a prior probability of 0.20. The relative risk takes on values from 10 to 400. Although the highly polygenic model yields a large proportion of individuals with posterior probabilities below 0.05, the increasing relative risks have little impact on the proportion of individuals with posterior probabilities above 0.95. The highly penetrant model shows an overall increase in the proportions of individuals with posterior probabilities below 0.05 and above 0.95, but the patterns are somewhat unexpected (not smooth, nor monotone). These patterns are generated from all predisposing SNVs having identical genotype frequencies and relative risks, coupled with having specific PPD thresholds.
Figure 8
Figure 8
AUC for inflammatory arthritis prediction study for the Marshfield population. The Naïve Bayes classifier developed using data from the literature was applied to the Marshfield population of inflammatory arthritis individuals: Rheumatoid arthritis (RA), Psoriatic arthritis (PsA), and Ankylosing spondylitis (AS). The model generated an AUC of 0.635, which was statistically significant via permutation. In addition, performance on randomized sample sets is shown in red, showing an expected null performance.

References

    1. Abraham G., Kowalczyk A., Zobel J., Inouye M. (2013). Performance and robustness of penalized and unpenalized methods for genetic prediction of complex human disease. Genet. Epidemiol. 37, 184–195 10.1002/gepi.21698 - DOI - PubMed
    1. Agrawal N., Frederick M. J., Pickering C. R., Bettegowda C., Chang K., Li R. J., et al. (2011). Exome sequencing of head and neck squamous cell carcinoma reveals inactivating mutations in NOTCH1. Science 333, 1154–1157 10.1126/science.1206923 - DOI - PMC - PubMed
    1. Akaike H. (1974). A new look at the statistical model identification. Automatic Control IEEE Trans. 19, 716–723 10.1109/tac.1974.1100705 - DOI
    1. Aletaha D., Neogi T., Silman A. J., Funovits J., Felson D. T., Bingham C. O., 3rd, et al. (2010). 2010 rheumatoid arthritis classification criteria: an American College of Rheumatology/European League Against Rheumatism collaborative initiative. Ann. Rheum. Dis. 69, 1580–1588 10.1136/ard.2010.138461 - DOI - PubMed
    1. Bao W., Hu F. B., Rong S., Rong Y., Bowers K., Schisterman E. F., et al. (2013). Predicting risk of type 2 diabetes mellitus with genetic risk models on the basis of established genome-wide association markers: a systematic review. Am. J. Epidemiol. 178, 1197–1207 10.1093/aje/kwt123 - DOI - PMC - PubMed