

Fructose transporters GLUT5 and GLUT2 expression in adult patients with fructose intolerance
- PMID: 24918004
- PMCID: PMC4040801
- DOI: 10.1177/2050640613505279
Fructose transporters GLUT5 and GLUT2 expression in adult patients with fructose intolerance
Abstract
Background: Gastrointestinal symptoms and malabsorption following fructose ingestion (fructose intolerance) are common in functional gastrointestinal disorders (FGID). The underlying mechanism is unclear, but is hypothesized to be related an abnormality of intestinal fructose transporter proteins.
Objective: To assess the expression of the main intestinal fructose transporter proteins, glucose transport protein 5 (GLUT5) and 2 (GLUT2), in FGID.
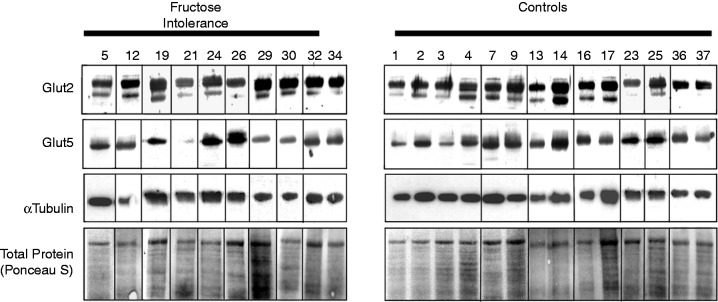
Methods: The expression of GLUT5 and GLUT2 protein and mRNA in small intestinal biopsy tissue was investigated using real-time reverse-transcription PCR and Western immunoblotting in 11 adults with FGID and fructose intolerance ascertained by breath testing and in 15 controls.
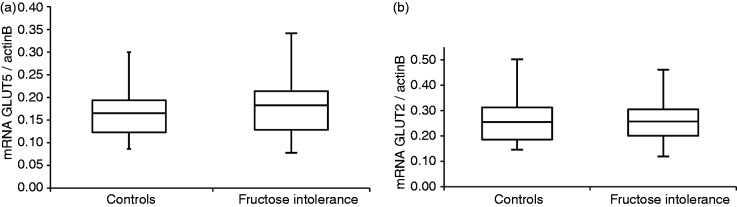
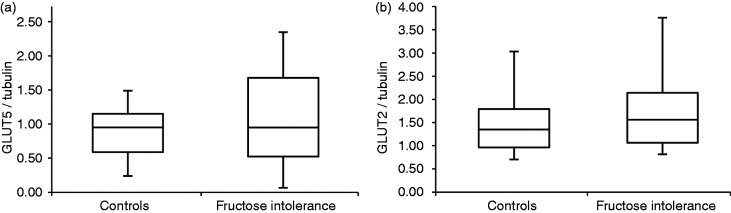
Results: Median expression levels of GLUT5 mRNA normalized to beta-actin were 0.18 (interquartile range, IQR, 0.13-0.21) in patients and 0.17 (IQR 0.12-0.19) in controls (p > 0.05). Respective levels of GLUT2 mRNA were 0.26 (IQR 0.20-0.31) and 0.26 (IQR 0.19-0.31) (p > 0.05). Median expression levels of GLUT5 protein normalized to alpha-tubulin were 0.95 (IQR 0.52-1.68) in patients and 0.95 (IQR 0.59-1.15) in controls (p > 0.05). Respective protein expression levels for GLUT2 were 1.56 (IQR 1.06-2.14) and 1.35 (IQR 0.96-1.79) (p > 0.05).
Conclusions: Human fructose intolerance may not be associated with marked changes in GLUT5 and GLUT2 expression. Replication of these results in a larger subject group, including measures of transporter activation and membrane and subcellular localization, is warranted.
Keywords: FODMAP; GLUT2; GLUT5; fructose intolerance; fructose transporters; irritable bowel syndrome; malabsorption; visceral pain.
Figures
References
-
- Barrett JS, Irving PM, Shepherd SJ, et al. Comparison of the prevalence of fructose and lactose malabsorption across chronic intestinal disorders. Aliment Pharmacol Ther 2009; 30: 165–174 - PubMed
-
- Marriott BP, Cole N, Lee E. National estimates of dietary fructose intake increased from 1977 to 2004 in the United States. J Nutr 2009; 139: 1228S–1235S - PubMed
-
- Park YK, Yetley EA. Intakes and food sources of fructose in the United States. Am J Clin Nutr 1993; 58: 737S–747S - PubMed
LinkOut - more resources
Full Text Sources
Other Literature Sources
