. 2014 May 21:4:30-45.
doi: 10.1016/j.rinim.2014.05.001. eCollection 2014.

Molecular pathway alterations in CD4 T-cells of nonobese diabetic (NOD) mice in the preinsulitis phase of autoimmune diabetes

Affiliations

Molecular pathway alterations in CD4 T-cells of nonobese diabetic (NOD) mice in the preinsulitis phase of autoimmune diabetes

Dorothy N Kakoola et al. Results Immunol. .

Abstract

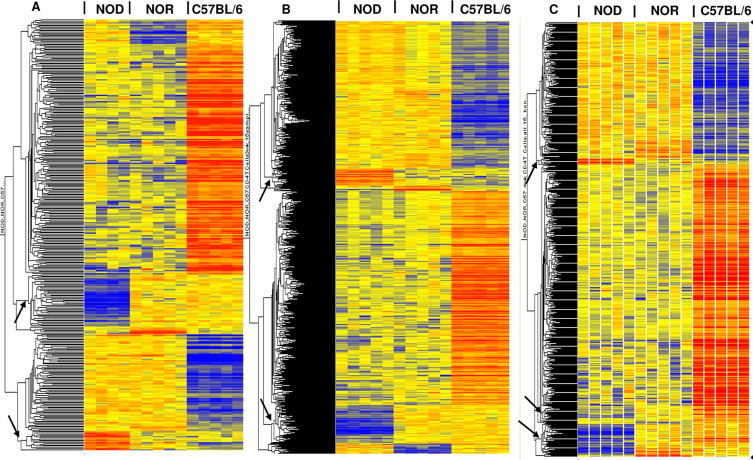
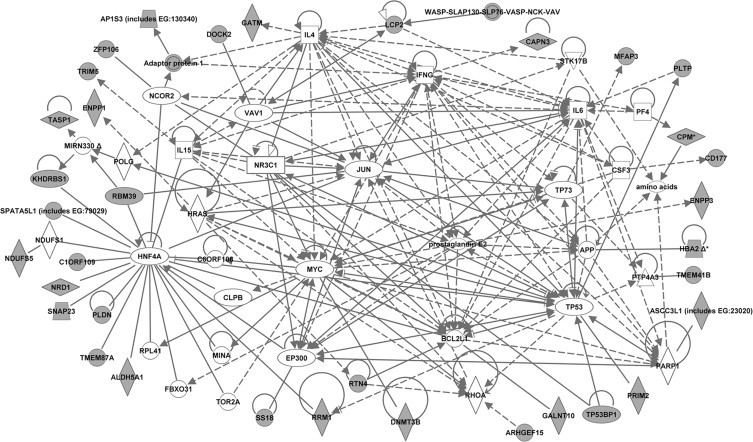
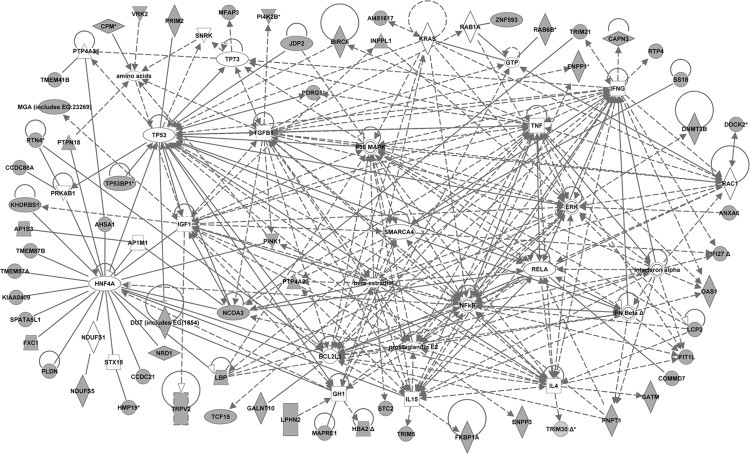
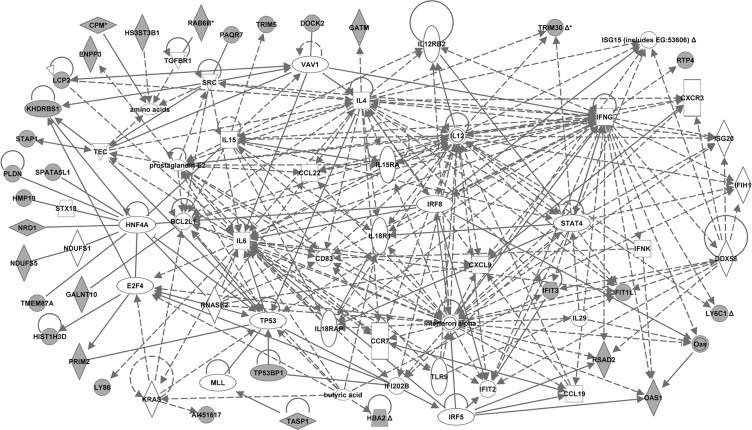
Type 1 diabetes (T1D) is a multigenic disease caused by T-cell mediated destruction of the insulin producing pancreatic islet ß-cells. The earliest sign of islet autoimmunity in NOD mice, islet leukocytic infiltration or insulitis, is obvious at around 5 weeks of age. The molecular alterations that occur in T cells prior to insulitis and that may contribute to T1D development are poorly understood. Since CD4 T-cells are essential to T1D development, we tested the hypothesis that multiple genes/molecular pathways are altered in these cells prior to insulitis. We performed a genome-wide transcriptome and pathway analysis of whole, untreated CD4 T-cells from 2, 3, and 4 week-old NOD mice in comparison to two control strains (NOR and C57BL/6). We identified many differentially expressed genes in the NOD mice at each time point. Many of these genes (herein referred to as NOD altered genes) lie within known diabetes susceptibility (insulin-dependent diabetes, Idd) regions, e.g. two diabetes resistant loci, Idd27 (tripartite motif-containing family genes) and Idd13 (several genes), and the CD4 T-cell diabetogenic activity locus, Idd9/11 (2 genes, KH domain containing, RNA binding, signal transduction associated 1 and protein tyrosine phosphatase 4a2). The biological processes associated with these altered genes included, apoptosis/cell proliferation and metabolic pathways (predominant at 2 weeks); inflammation and cell signaling/activation (predominant at 3 weeks); and innate and adaptive immune responses (predominant at 4 weeks). Pathway analysis identified several factors that may regulate these abnormalities: eight, common to all 3 ages (interferon regulatory factor 1, hepatic nuclear factor 4, alpha, transformation related protein 53, BCL2-like 1 (lies within Idd13), interferon gamma, interleukin 4, interleukin 15, and prostaglandin E2); and two each, common to 2 and 4 weeks (androgen receptor and interleukin 6); and to 3 and 4 weeks (interferon alpha and interferon regulatory factor 7). Others were unique to the various ages, e.g. myelocytomatosis oncogene, jun oncogene, and amyloid beta (A4) to 2 weeks; tumor necrosis factor, transforming growth factor, beta 1, NF?B, ERK, and p38MAPK to 3 weeks; and interleukin 12 and signal transducer and activator of transcription 4 to 4 weeks. Thus, our study demonstrated that expression of many genes that lie within several Idds (e.g. Idd27, Idd13 and Idd9/11) was altered in CD4 T-cells in the early induction phase of autoimmune diabetes and identified their associated molecular pathways. These data offer the opportunity to test hypotheses on the roles played by the altered genes/molecular pathways, to understand better the mechanisms of CD4 T-cell diabetogenesis, and to develop new therapeutic strategies for T1D.

Keywords: CD4 T-cells; Genome-wide gene expression profiling; Molecular pathway analysis; NOD mice; Preinsulitis; Type 1 diabetes susceptibility regions.


Figures

Fig. 1
Fig. 1
Hierarchical clusters of genes whose expression was altered in CD4 T-cells. 362 (A), 982 (B) and 581 (C) genes were differentially expressed between strains at 2, 3, and 4 weeks of age, respectively. The lists were identified by a one-way ANOVA of ~31,000 filtered probe sets at p < 0.005, with Benjamini–Hochberg multiple test correction. A total of 58, 115, and 65 probe sets were differentially expressed in NOD relative to both controls (NOR and C57BL/6) at 2-, 3- and 4-weeks, respectively; clusters of these NOD altered genes are indicated by arrows. The color intensity of the rectangles representing each gene for each sample (n = 5 for each strain/age, except NOD 2 week, where n = 4) indicates the degree of increase (red) or decrease (blue) of the gene expression signal relative to the mean signal intensity (yellow).
Fig. 2
Fig. 2
Molecular network generated by ingenuity pathway analysis (IPA) from the dataset of 2 week-old mice. The merged network was generated from the list of genes differentially expressed in CD4 T-cells from 2-week old NOD mice compared to both control strains (NOR and C57BL/6). The list was selected from the hierarchical cluster of 362 genes that had highly significant (p < 0.005, Benjamini–Hochberg) expression differences between strains at 2 weeks of age. The genes derived from our uploaded gene list (known as focus genes) are represented by gray icons while genes (or endogenous chemicals) derived from the IPA knowledge base that could be algorithmically connected to the focus genes are represented by white icons. Different shapes of the symbols represent the different classes of genes/molecules, e.g. squares = cytokines/growth factors; ovals = transcription factors, etc.
Fig. 3
Fig. 3
Molecular network generated by ingenuity pathway analysis (IPA) from the dataset of 3 week-old mice. The merged network was generated from the list of genes differentially expressed in CD4 T-cells from 3-week old NOD mice compared to both control strains (NOR and C57BL/6). The list was selected from the hierarchical cluster of 982 genes that had highly significant (p < 0.005, Benjamini–Hochberg) expression differences between strains at 3 weeks of age. The genes derived from our uploaded gene list (known as focus genes) are represented by gray icons while genes (or endogenous chemicals) derived from the IPA knowledge base that could be algorithmically connected to the focus genes are represented by white icons. Different shapes of the symbols represent the different classes of genes/molecules, e.g. squares = cytokines/growth factors; ovals = transcription factors, etc.
Fig. 4
Fig. 4
Molecular network generated by ingenuity pathway analysis (IPA) from the dataset of 4 week-old mice. The merged network was generated from the list of genes differentially expressed in CD4 T-cells from 4-week old NOD mice compared to both control strains (NOR and C57BL/6). The list was selected from the hierarchical cluster of 581 genes that had highly significant (p < 0.005, Benjamini–Hochberg) expression differences between strains at 4 weeks of age. The genes derived from our uploaded gene list (known as focus genes) are represented by gray icons while genes (or endogenous chemicals) derived from the IPA knowledge base that could be algorithmically connected to the focus genes are represented by white icons. Different shapes of the symbols represent the different classes of genes/molecules, e.g. squares = cytokines/growth factors; ovals = transcription factors, etc..

References

    1. Anderson M.S., Bluestone J.A. The NOD mouse:a model of immune dysregulation. Annual Review of Immunology. 2005;23:447–485. 15771578 - PubMed
    1. Serreze D.V., Leiter E.H. Genes and cellular requirements for autoimmune diabetes susceptibility in nonobese diabetic mice. Current Directions in Autoimmunity. 2001;4:31–67. 11569409 - PubMed
    1. Todd J.A., Wicker L.S. Genetic protection from the inflammatory disease type 1 diabetes in humans and animal models. Immunity. 2001;15:387–395. 11567629 - PubMed
    1. Driver J.P., Serreze D.V., Chen Y.-G. Mouse models for the study of autoimmune type 1 diabetes:a NOD to similarities and differences to human disease. Seminars in Immunopathology. 2011;33:67–87. 20424843 - PubMed
    1. Chen Y.-G., Scheuplein F., Osborne M.A., Tsaih S.-W., Chapman H.D., Serreze D.V. Idd9/11 genetic locus regulates diabetogenic activity of CD4 T-cells in nonobese diabetic (NOD) mice. Diabetes. 2008;57:3273–3280. 18776136 - PMC - PubMed