. 2014 Apr 4:4:377-86.
doi: 10.1016/j.fob.2014.03.013. eCollection 2014.

Fructose 1-phosphate is the one and only physiological effector of the Cra (FruR) regulator of Pseudomonas putida

Affiliations

Fructose 1-phosphate is the one and only physiological effector of the Cra (FruR) regulator of Pseudomonas putida

Max Chavarría et al. FEBS Open Bio. .

Abstract

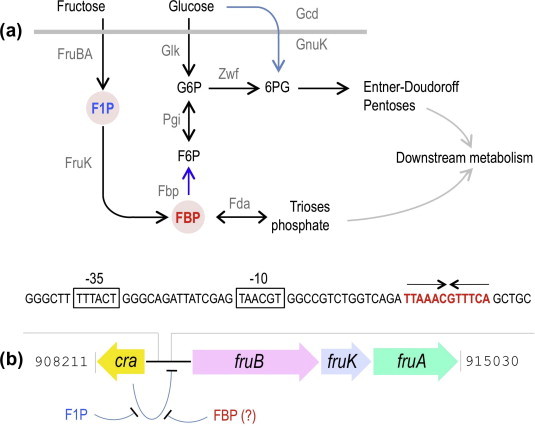
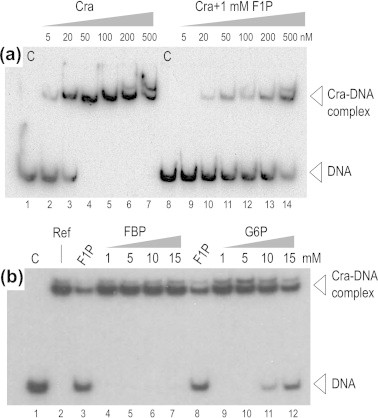
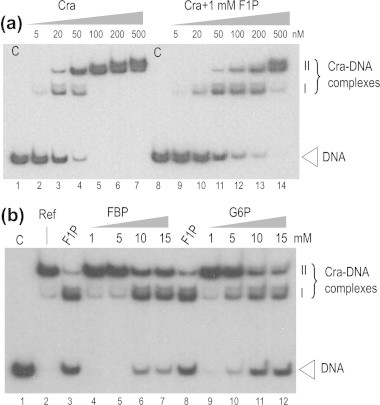
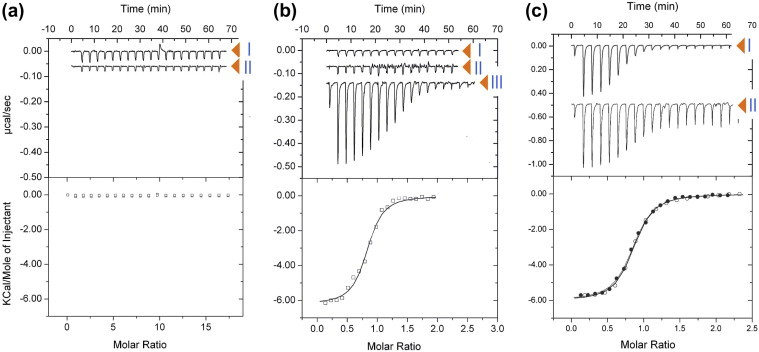
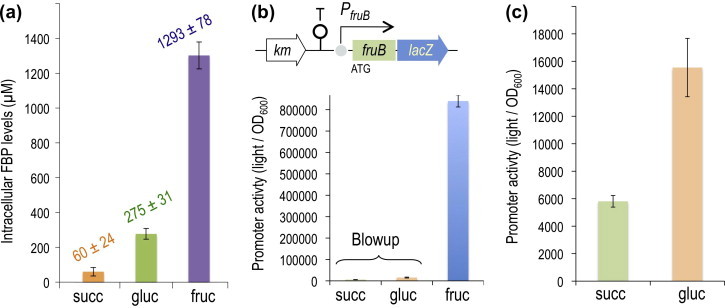
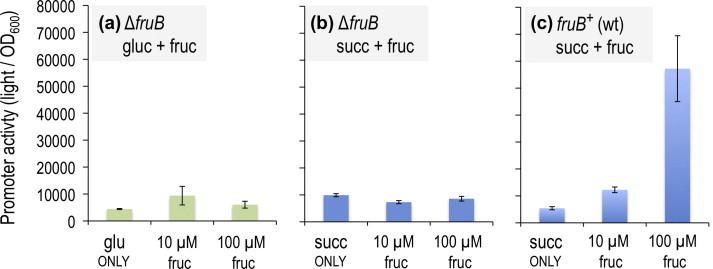
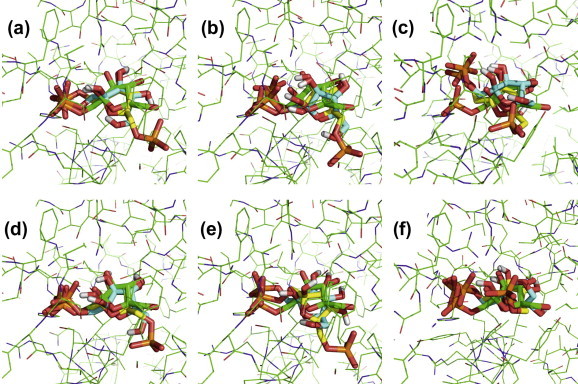
Fructose-1-phosphate (F1P) is the preferred effector of the catabolite repressor/activator (Cra) protein of the soil bacterium Pseudomonas putida but its ability to bind other metabolic intermediates in vivo is unclear. The Cra protein of this microorganism (Cra(PP)) was submitted to mobility shift assays with target DNA sequences (the PfruB promoter) and candidate effectors fructose-1,6-bisphosphate (FBP), glucose 6-phosphate (G6P), and fructose-6-phosphate (F6P). 1 mM F1P was sufficient to release most of the Cra protein from its operators but more than 10 mM of FBP or G6P was required to free the same complex. However, isothermal titration microcalorimetry failed to expose any specific interaction between Cra(PP) and FBP or G6P. To solve this paradox, transcriptional activity of a PfruB-lacZ fusion was measured in wild-type and ΔfruB cells growing on substrates that change the intracellular concentrations of F1P and FBP. The data indicated that PfruB activity was stimulated by fructose but not by glucose or succinate. This suggested that Cra(PP) represses expression in vivo of the cognate fruBKA operon in a fashion dependent just on F1P, ruling out any other physiological effector. Molecular docking and dynamic simulations of the Cra-agonist interaction indicated that both metabolites can bind the repressor, but the breach in the relative affinity of Cra(PP) for F1P vs FBP is three orders of magnitude larger than the equivalent distance in the Escherichia coli protein. This assigns the Cra protein of P. putida the sole role of transducing the presence of fructose in the medium into a variety of direct and indirect physiological responses.

Keywords: Cra; Cra, catabolic repression/activation protein; F1P, fructose-1-phosphate; F6P, fructose-6-phosphate; FBP, fructose-1,6-bisphosphate; FruR; Fructose 1-phosphate; Fructose operon; G6P, glucose 6-phosphate; ITC, isothermal calorimetry; Pseudomonas putida.


Figures

Fig. 1
Fig. 1
Metabolic regulation of the fructose operon of P. putida. (a) Generation of F1P and FBP upon entry of hexoses in the metabolic network of P. putida. F1P is produced from extracellular fructose, which enters the cell through the PTSFru system (FruBA). FBP is generated also from fructose by phosphorylation of F1P by FruK. When growing on glucose or succinate the lack of phosphofructokinase makes FBP to be produced exclusively through a back reaction of trioses into hexoses. Relevant enzymes and transformations are indicated (see Supplementary Fig. S1 for an expanded metabolic map). (b) Regulatory region of the fruBKA operon of P. putida. Note the organization of the genes and the PfruB promoter containing one Cra operator (the quasi-palindromic 5′TTAAACGTTTCA3′ sequence in red). While F1P de-represses the promoter by releasing Cra binding to PfruB, the role of FBP is less clear. Numbers flanking the operon indicate the genomic coordinates of the fruR fruBKA operon of P. putida KT2440.
Fig. 2
Fig. 2
Interactions of the Cra protein of P. putida with its target region of the fructose operon in response to various metabolic effectors. (a) Retardation assay with increasing concentrations of Cra in the absence or presence of F1P 1 mM. Lane 1: Control free DNA probe containing the PfruB promoter of P. putida, which has one single Cra operator (Fig. 1b). Lanes 2–7: 5 to 500 nM of Cra protein-only, no effector. Lane 8: DNA probe in the presence of 1 mM F1P, no protein (control, C). Lanes 9–14: 5 to 500 nM of Cra protein with 1 mM F1P. (b) Retardation assay with 50 nM of Cra and different candidate effectors. Lane 1: free DNA probe, no protein (control, C). Lane 2: 50 nM Cra only, no effectors (Ref). Lane 3: 50 nM Cra protein and 1 mM F1P. Lanes 4–7: 50 nM Cra protein and 1–15 mM FBP. Lane 8: 50 nM Cra protein and 1 mM F1P. Lanes 9–12: 50 nM Cra protein 50 nM and 1–15 mM of G6P. Gel experiments were performed as indicated in the Section 4.
Fig. 3
Fig. 3
Binding of the Cra protein of P. putida to a target DNA containing two cooperative sites. (a) Retardation assay with increasing concentrations of Cra in the absence or presence of F1P 1 mM. Lane 1: Control free DNA probe containing the PfruB promoter of E. coli, which has two cooperative Cra-binding sites (Supplementary Fig. S2). Lanes 2–7: 5 to 500 nM of Cra protein-only, no effector. Lane 8: DNA probe in the presence of 1 mM F1P, no protein (control, C). Lanes 9–14: 5 to 500 nM of Cra protein with 1 mM F1P. (b) Retardation assay with 50 nM of Cra and different candidate effectors. Lane 1: free DNA probe, no protein (control, C). Lane 2: 50 nM Cra only, no effectors (Ref). Lane 3: 50 nM Cra protein and 1 mM F1P. Lanes 4–7: 50 nM Cra protein and 1–15 mM FBP. Lane 8: 50 nM Cra protein and 1 mM F1P. Lanes 9–12: 50 nM Cra protein 50 nM and 1–15 mM of G6P.
Fig. 4
Fig. 4
ITC assays with Cra and effectors. The upper panels plot raw data from representative ITC experiments, whereas the lower panels show the fitted curves of the same results but integrated and corrected for dilution. (a) Titration of dialysis buffer (I) and 12 μM of Cra (II) with 14.4 μl aliquots of 1 mM FBP. (b) Titration of dialysis buffer (I) and 12 μM of Cra (II) with 14.4 μl aliquots of 1 mM G6P. (III) corresponds to positive control. i.e., titration of 12 μM of Cra with 3.2 μl aliquots of 0.5 mM of F1P. (c) ITC competition experiments were performed by titration of 12 μM Cra containing 5 mM FBP with 4.8 μl of a mixture of 0.45 μM F1P and 5 mM FBP (II and filled circles in the bottom panel). The figure also shows the titration of 12 μM Cra with 4.8 μl aliquots of 0.5 mM F1P (I, and empty circles in the bottom panel). The bottom panel corresponds to the superposition of the titration curves of the experiments mentioned above, which are virtually identical, suggesting that FBP does not bind to CraPP. Note that only the titration with F1P produces a heat change in the experiment at the tested concentrations. Negative peaks are indicative of an exothermic event.
Fig. 5
Fig. 5
Metabolic control of PfruB activity. (a) FBP levels in P. putida growing on glycolytic (fructose and glucose) and gluconeogenic (succinate) substrates. Wild-type cells of P. putida KT2440 were grown in M9 media with the substrate indicated until the mid-exponential phase and then processed for measuring FBP levels by HPLC-MS as described in the Section 4. The data shown correspond to three independent samples, the error bars representing the standard deviations of the mean. (b) PfruB activity in cells grown on succinate, glucose and fructose as the sole C source. A schematic diagram of the fruB′-′lacZ gene fusion borne by reporter plasmid pMCH1 is sketched on top. Note the very high activity in cells grown on fructose in contrast with those in succinate or glucose. (c) Blowup of lacZ readout of P. putida (pMCH1) cells growing on succinate or glucose.
Fig. 6
Fig. 6
Effect of ΔfruB on the activity of a fruB′-′lacZ fusion. PfruB activity in P. putida (pMCH1) cells lacking the fruB gene growing in (a) glucose with increasing concentrations (10 and 100 μM) of fructose and (b) succinate with increasing concentrations (10 and 100 μM) of fructose. (c) PfruB activity in wild type cells grown with succinate plus fructose. β-Galactosidase activity was measured with Galacton-Plus® as described in the Section 4. Note that lacZ levels of the ΔfruB strain remain unchanged regardless of succinate or glucose, plausibly due to the inability of cells to internalize fructose and thus generate F1P.
Fig. 7
Fig. 7
Binding modes of F1P and FBP exposed by molecular docking of the effector molecules to the crystal structures of CraPP and CraEC. Predicted binding modes of F1P (cyan sticks) and FBP (yellow sticks) obtained from docking into (a) chain A of CraPP complexed with F1P (structure PDB: 3O75), (b) chain A of effector-free CraPP (structure PDB: 3O74), (c) chain A of effector-free CraEC (structure PDB: 2IKS), (d) chain B of CraPP complexed with F1P (structure PDB: 3O75), (e) chain B of effector-free CraPP (structure PDB: 3O74) and (f) chain B of effector-free CraEC (structure PDB: 2IKS). The experimentally determined conformation of F1P is shown with green sticks and the protein structures with green lines.

References

    1. Saier M.H., Jr., Ramseier T.M. The catabolite repressor/activator (Cra) protein of enteric bacteria. J. Bacteriol. 1996;178:3411–3417. - PMC - PubMed
    1. Ramseier T.M. Cra and the control of carbon flux via metabolic pathways. Res. Microbiol. 1996;147:489–493. - PubMed
    1. Ow D.S., Lee R.M., Nissom P.M., Philp R., Oh S.K., Yap M.G. Inactivating FruR global regulator in plasmid-bearing Escherichia coli alters metabolic gene expression and improves growth rate. J. Biotechnol. 2007;131:261–269. - PubMed
    1. Bledig S.A., Ramseier T.M., Saier M.H., Jr. FruR mediates catabolite activation of pyruvate kinase (pykF) gene expression in Escherichia coli. J. Bacteriol. 1996;178:280–283. - PMC - PubMed
    1. Sarkar D., Siddiquee K.A., Arauzo-Bravo M.J., Oba T., Shimizu K. Effect of cra gene knockout together with edd and iclR genes knockout on the metabolism in Escherichia coli. Arch. Microbiol. 2008;190:559–571. - PubMed

LinkOut - more resources