. 2014 May 9:4:458-67.
doi: 10.1016/j.fob.2014.04.007. eCollection 2014.

Extracellular vesicle-mediated transfer of long non-coding RNA ROR modulates chemosensitivity in human hepatocellular cancer

Affiliations

Extracellular vesicle-mediated transfer of long non-coding RNA ROR modulates chemosensitivity in human hepatocellular cancer

Kenji Takahashi et al. FEBS Open Bio. .

Abstract

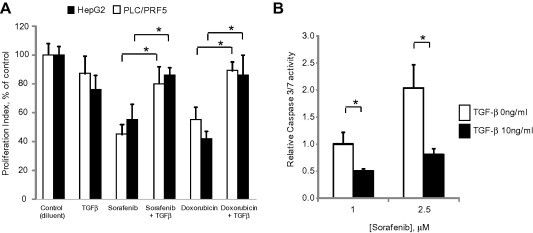
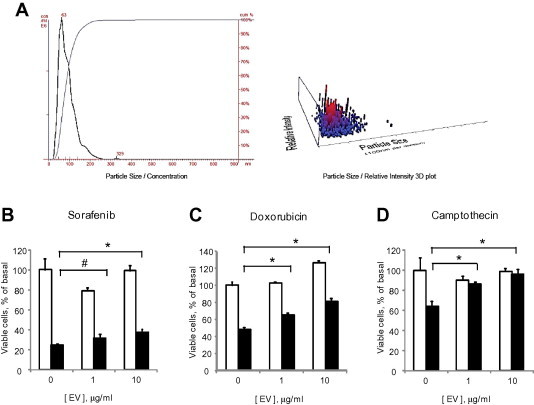
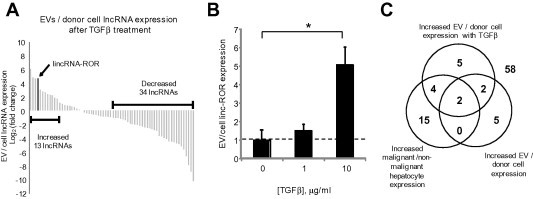
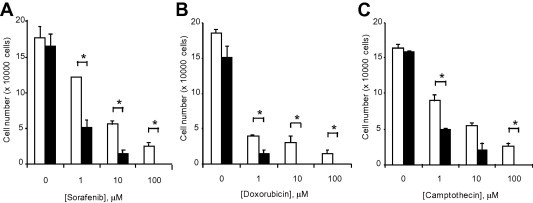
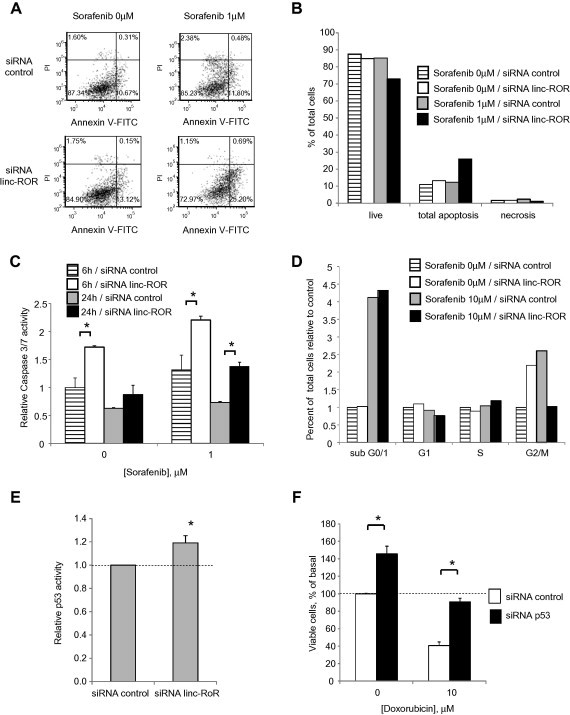
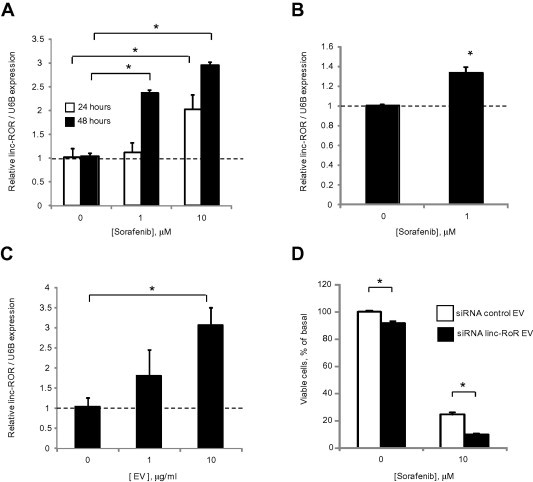
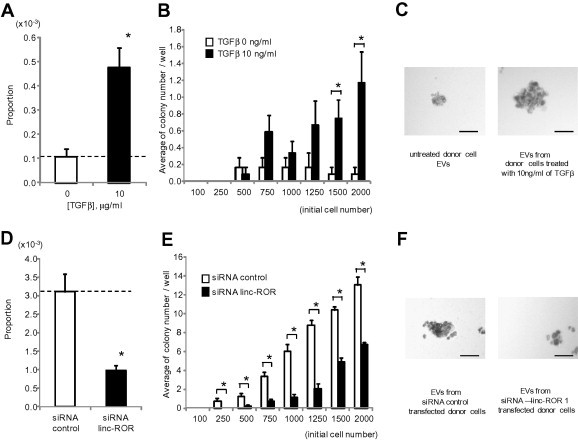
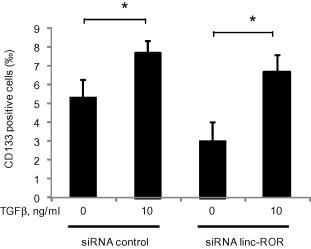
Hepatocellular cancers (HCC) are highly resistant to chemotherapy. TGFβ has been associated with chemoresistance in some human cancers but the mechanisms involved are unknown. We explored how TGFβ might contribute to altered responses to therapy by assessing the involvement and mechanistic contribution of extracellular vesicle long non-coding RNA (lncRNA) in mediating TGFβ-dependent chemoresistance. TGFβ reduced the sensitivity of HCC cells to sorafenib or doxorubicin and altered the release of both extracellular vesicles and of selected lncRNA within these vesicles. Amongst these, lincRNA-ROR (linc-ROR), a stress-responsive lncRNA was highly expressed in HCC cells and enriched within extracellular vesicles derived from tumor cells. Incubation with HCC-derived extracellular vesicles increased linc-ROR expression and reduced chemotherapy-induced cell death in recipient cells. Sorafenib increased linc-ROR expression in both tumor cells and extracellular vesicles, whereas siRNA to linc-ROR increased chemotherapy-induced apoptosis and cytotoxicity. Tumor-initiating cells that express CD133 have an increased resistance to therapy. TGFβ increased expression of CD133+ cells and colony growth in limiting dilution assays, both of which were attenuated by linc-ROR knockdown. These data provide mechanistic insights into primary chemoresistance in HCC by showing that: (a) TGFβ selectively enriches linc-RoR within extracellular vesicles, which has a potential role in intercellular signaling in response to TGFβ; (b) expression and enrichment of linc-ROR during chemotherapeutic stress plays a functional role in chemoresistance; and (c) the effects of TGFβ on chemoresistance in HCC may involve linc-RoR-dependent effects on tumor-initiating cells. These findings implicate extracellular vesicle lncRNA as mediators of the chemotherapeutic response, and support targeting linc-ROR to enhance chemosensitivity in HCC.

Keywords: CT, cycle threshold; Chemoresistance; EV, extracellular vesicle; Exosomes; Gene expression; HCC, hepatocellular carcinoma; Liver cancer; RNA genes; TGFβ, transforming growth factor β; VD, vesicle-depleted; linc-ROR, long intergenic non-coding RNA; lncRNA, long non-coding RNA; miRNA, microRNA; siRNA, small interfering RNA.


Figures

Fig. 1
Fig. 1
TGFβ modulates chemosensitivity of HCC cells. (A) HepG2 or PLC/PRF-5 HCC cells (1 × 104/well) were cultured in 96 well collagen-coated plates for 24 h. Cells were then exposed to diluent (controls), TGFβ (10 ng/ml), doxorubicin (25 nM for HepG2 cells or 1.0 μM for PLC/PRF-5 cells) or sorafenib (2.5 μM). Cell proliferation was assessed after 72 h using CellTiter 96 Aqueous Non-Radioactive Cell Proliferation Assay. Proliferation index represents absorbance values expressed as a percentage of control cells. (B) HepG2 cells were plated (1 × 104/well) in a 96 well plate and incubated with 0 or 10 ng/ml of TGFβ for 24 h. Cells were then exposed to 1 or 2.5 μM sorafenib for 6 h. Caspase-3/7 activity was assessed using a commercial luminometric assay. Data were expressed relative to luminescence values of 1 μM sorafenib without TGFβ. Data represents the means ± standard error of the mean (SEM) of 3 separate studies, with each study conducted in quadruplicate. p < 0.05.
Fig. 2
Fig. 2
Tumor cell derived EV modulate chemosensitivity. (A) Analysis of extracellular vesicles (EVs) derived from HepG2 cells by nanoparticle tracking analysis using a Nanosight N-300. The analysis revealed EVs with a mean size of 90 ± 40 nm. (B–D) HepG2 cells (1 × 104/well) were plated in 96 well collagen-coated plates in EV depleted medium and incubated with different concentrations of EVs. After 24 h, cells were exposed to diluent (white bars) or 10 μM (black bars) of (B) sorafenib, (C) doxorubicin or (D) camptothecin and cell viability was assessed after 48 h using an MTS assay. Bars express the mean value ± SEM of 3 separate studies, each performed in quadruplicate. p < 0.05, #p = 0.13.
Fig. 3
Fig. 3
Effect of TGFβ on lncRNA enrichment within EV. (A) Expression profiling of 90 lncRNAs was performed in donor HepG2 cells and EV derived from these cells after 72 h incubation with 10 ng/ml of TGFβ from three independent samples. Sixty-eight lncRNAs were identified in EVs of which thirteen lncRNAs were increased by >2-fold change in EVs compared to their donor cells. Each column represents an independent lncRNA. (B) The expression of linc-ROR was assessed by qRT-PCR in HepG2 derived EVs following incubation of donor cells with 0, 1 or 10 ng/ml TGFβ for 72 h. Linc-ROR in EVs was expressed relative to expression in donor cells and normalized to that of RNU6B. Bars represent the mean value ± SEM of 3 separate determinants. p < 0.05. (C) The Venn diagram summarizes the results of lncRNA profiling and illustrates number of lncRNA for which the ratio was greater than 2-fold in each group. The central overlap indicates two lncRNA that were selectively enriched in all three profiling studies, and includes linc-ROR and lincRNA-VLDLR.
Fig. 4
Fig. 4
Linc-ROR knockdown modulates chemotherapeutic response. (A–C) HepG2 cells were transfected with siRNAs against linc-ROR-1 (black bars) or non-targeting control siRNA (white bars). After 48 h, cells were plated (1 × 104/well) on 96 well plates and treated with (A) sorafenib, (B) doxorubicin or (C) camptothecin at the indicated concentrations. The number of viable cells was counted after 48 h using a hemocytometer after trypan blue staining. Bars express the mean value ± SEM of 3 separate determinants. p < 0.05.
Fig. 5
Fig. 5
Cellular effects of linc-ROR knockdown. (A–E) HepG2 cells were transfected with either siRNA to linc-ROR-1 or non-targeting control siRNA for 48 h. (A, B) Transfected cells were incubated with 1 μM sorafenib, and analyzed 24 h later using an Accuri C6 flow cytometer after staining with annexin V/propidium iodide. Cells in live, apoptosis and necrosis group are expressed as percentages of the total cell population. (C) Transfected cells were plated (1 × 104/well) in a 96 well plate and incubated with diluent or 1 μM sorafenib for either 6 or 24 h. Caspase-3/7 activity was assessed using a commercial luminometric assay. Data were expressed relative to luminescence values of controls without sorafenib. (D) Transfected cells were incubated with 10 μM sorafenib. After 24 h, cell cycle analysis was performed using Accuri C6 flow cytometer after staining with propidium iodide. Cells in sub G0/1, G1, S, and G2/M phases of the cell cycle are expressed as percentages of the total cell population. (E) Transfected cells were then cotransfected with p53-Luc Plasmid and pRL-TK Renilla Vector. After 24 h, luciferase expression was measured. p53 luciferase activity was normalized to that of Renilla and expressed relative to control. (F) HepG2 cells were transfected with either siRNA to p53 or non-targeting control siRNA for 24 h. Cells were then incubated with diluent or 10 μM doxorubicin. After 48 h, cell viability was assessed using an MTS assay. Bars express the mean value ± SEM of 3 separate determinations. p < 0.05.
Fig. 6
Fig. 6
Cellular and extracellular vesicle linc-ROR in response to sorafenib. (A) HepG2 cells were incubated with varying concentrations of sorafenib, and linc-ROR expression was examined by qRT-PCR after 24 or 48 h. (B) HepG2 cells were incubated with 1 μM sorafenib or diluent controls. After 24 h, EVs were isolated and EV linc-ROR expression examined by qRT-PCR. (C) HepG2 cells were incubated with different concentrations of isolated EVs. After 24 h incubation, linc-ROR expression was assessed by qRT-PCR in recipient HepG2 cells. Expression of linc-ROR was normalized using the expression of RNU6B and expressed relative to controls. (D) HepG2 cells were transfected with either siRNA to linc-ROR-1 or non-targeting control siRNA for 24 h, then cultured in vesicle-depleted medium. After 72 h, EVs were collected and added to recipient HepG2 cells in 96 well plate. Recipient cells were then incubated with diluent or 10 μM sorafenib and cell viability assessed after 48 h using an MTS assay. Bars express the mean value ± SEM of 3 separate determinations. p < 0.05.
Fig. 7
Fig. 7
Effect of TGFβ and linc-ROR on spheroid formation. Stromal independent growth was examined in single cells in a limiting dilution assay. (A–C) EVs were isolated from donor HepG2 cells incubated with diluent or 10 ng/ml of TGFβ for 72 h. Recipient HepG2 cells were incubated with these EVs for 48 h. Cells were then collected and plated on Ultra-Low Attachment 96 well plates with serum free DMEM medium. (D–F) HepG2 cells were transfected with either siRNA to linc-ROR-1 or non-targeting control siRNA. After 48 h, cells were collected and plated on Ultra-Low Attachment 96 well plates with DMEM medium containing 1% FBS. Spheroid formation assays were performed as described in Section 2 after 7 days. (A, D) Proportion of cells forming spheroids. (B, E) Relationship between initial cell number and average number of colonies per well. Bars express the mean value ± SEM of 12 separate determinants based on Poisson distribution. p < 0.05. (C, F) Representative photographs of spheroids at day 7 with 2000 cells/well incubated with EVs isolated from cells incubated with diluent or 10 ng/ml TGFβ, or transfected with control siRNA or siRNA to linc-ROR-1. Bar represents 100 μm.
Fig. 8
Fig. 8
Effect of TGFβ and EV linc-ROR on CD133 tumor-initiating cells. HepG2 cells were transfected with either siRNA to linc-ROR-1 or non-targeting control siRNAs. After 48 h, cells were collected and plated in 10 cm dishes in EV-depleted medium followed by incubation for 72 h with 0 or 10 ng/ml TGFβ. EVs were then isolated from each cell. Recipient HepG2 cells were incubated with EV from each group for 48 h, and CD133 expression was assessed by flow cytometry. Bar graphs represent the mean and standard error of the permillage of CD133 positive cells from 3 separate determinants. p < 0.05.

References

    1. El-Serag H.B., Rudolph K.L. Hepatocellular carcinoma: epidemiology and molecular carcinogenesis. Gastroenterology. 2007;132:2557–2576. - PubMed
    1. Llovet J.M., Ricci S., Mazzaferro V., Hilgard P., Gane E., Blanc J.F. Sorafenib in advanced hepatocellular carcinoma. N. Engl. J. Med. 2008;359:378–390. - PubMed
    1. Asghar U., Meyer T. Are there opportunities for chemotherapy in the treatment of hepatocellular cancer? J. Hepatol. 2012;56:686–695. - PubMed
    1. Hernandez-Gea V., Toffanin S., Friedman S.L., Llovet J.M. Role of the microenvironment in the pathogenesis and treatment of hepatocellular carcinoma. Gastroenterology. 2013;144:512–527. - PMC - PubMed
    1. Li Y., Wang J., Asahina K. Mesothelial cells give rise to hepatic stellate cells and myofibroblasts via mesothelial–mesenchymal transition in liver injury. Proc. Natl. Acad. Sci. U.S.A. 2013;110:2324–2329. - PMC - PubMed