. 2014 Jun 11;9(6):e99240.
doi: 10.1371/journal.pone.0099240. eCollection 2014.

Seasonal distribution and historic trends in abundance of white sharks, Carcharodon carcharias, in the western North Atlantic Ocean

Affiliations

Seasonal distribution and historic trends in abundance of white sharks, Carcharodon carcharias, in the western North Atlantic Ocean

Tobey H Curtis et al. PLoS One. .

Abstract

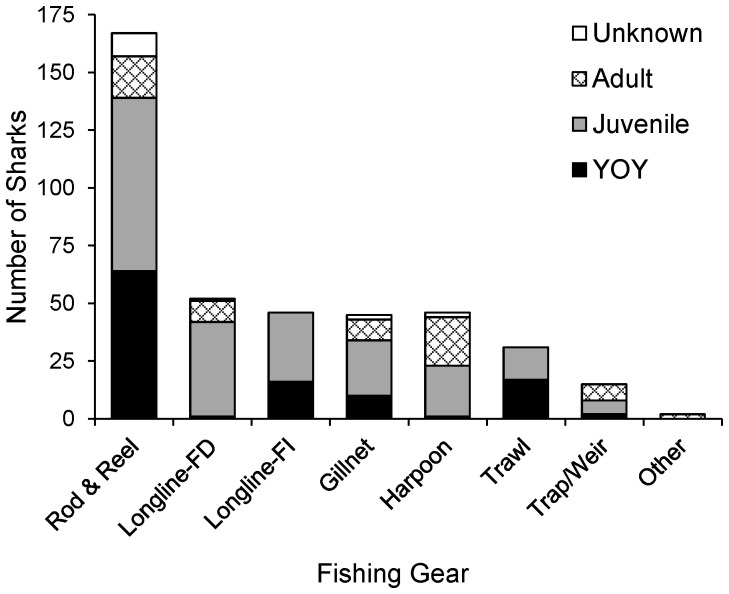
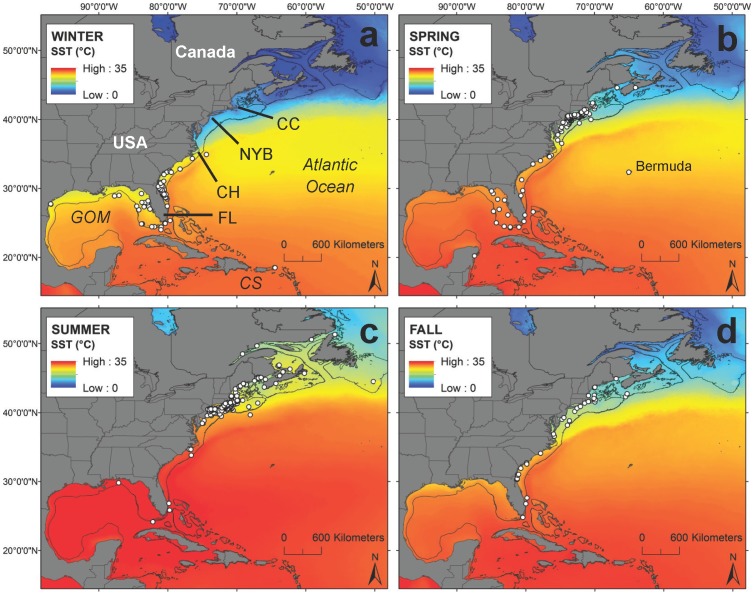
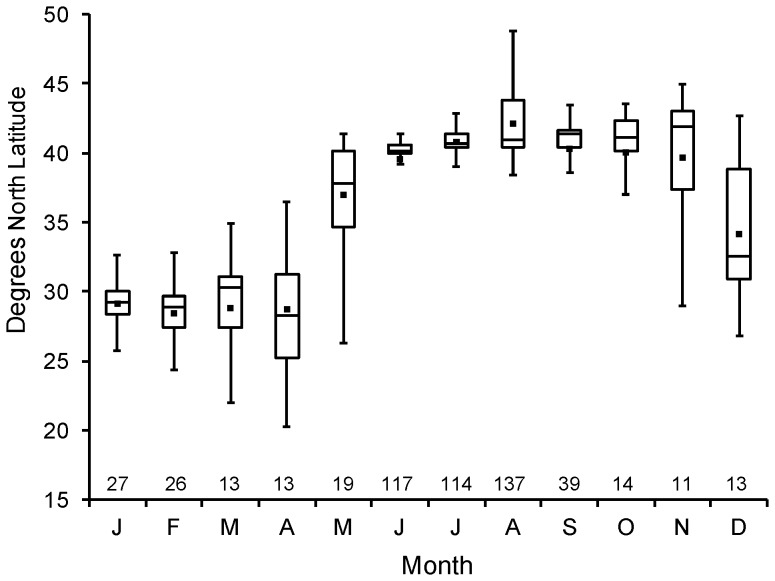
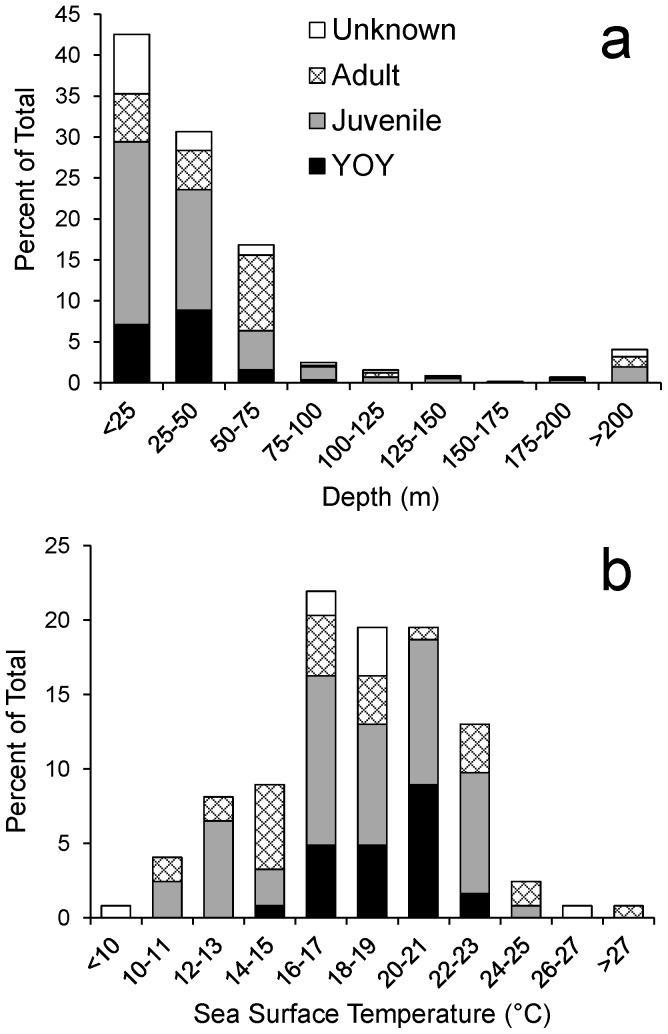
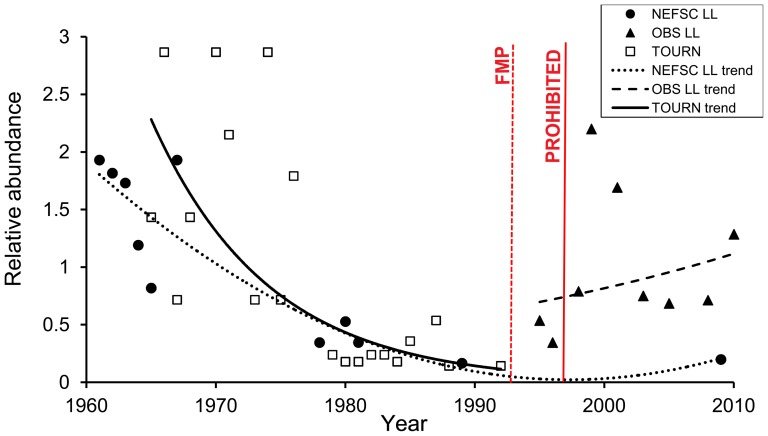
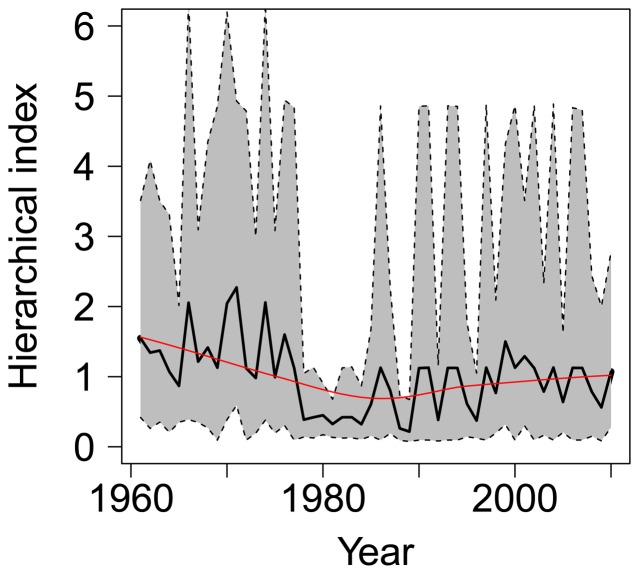
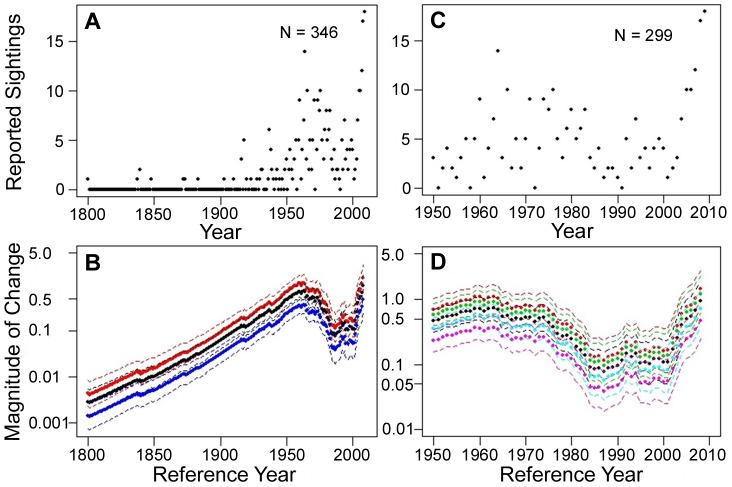
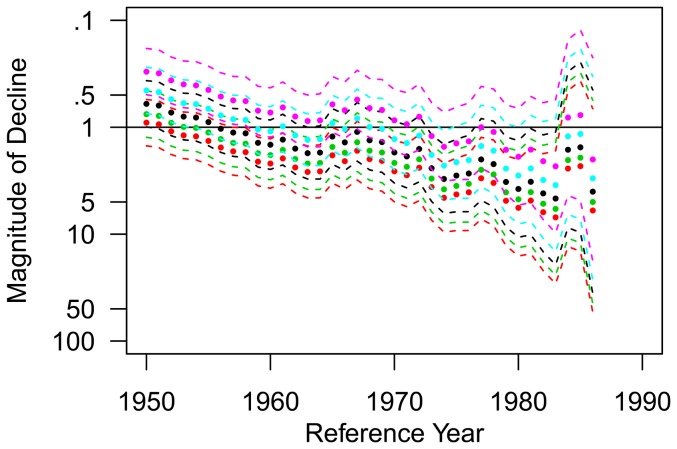
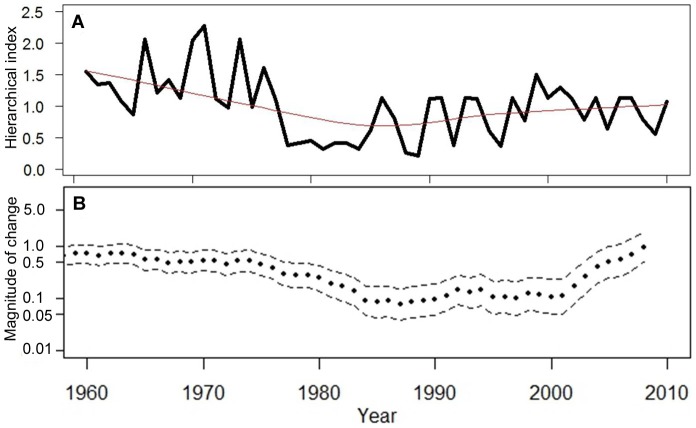
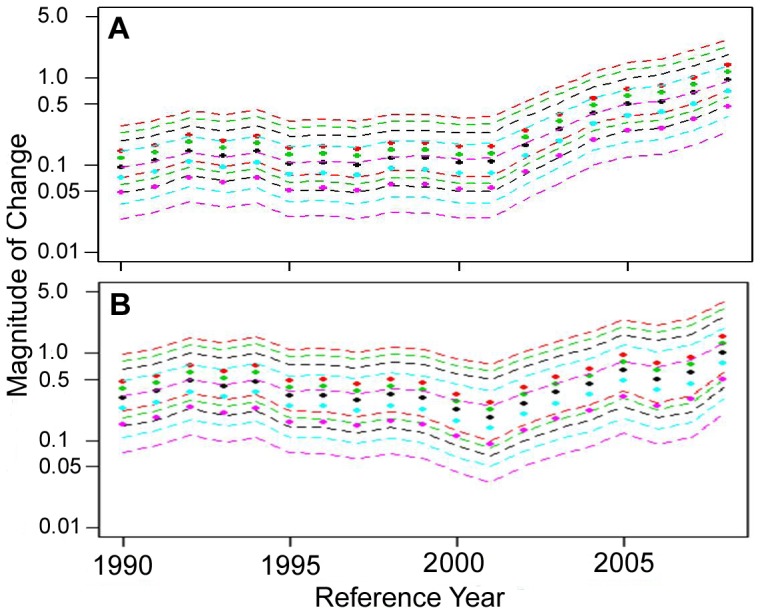
Despite recent advances in field research on white sharks (Carcharodon carcharias) in several regions around the world, opportunistic capture and sighting records remain the primary source of information on this species in the northwest Atlantic Ocean (NWA). Previous studies using limited datasets have suggested a precipitous decline in the abundance of white sharks from this region, but considerable uncertainty in these studies warrants additional investigation. This study builds upon previously published data combined with recent unpublished records and presents a synthesis of 649 confirmed white shark records from the NWA compiled over a 210-year period (1800-2010), resulting in the largest white shark dataset yet compiled from this region. These comprehensive records were used to update our understanding of their seasonal distribution, relative abundance trends, habitat use, and fisheries interactions. All life stages were present in continental shelf waters year-round, but median latitude of white shark occurrence varied seasonally. White sharks primarily occurred between Massachusetts and New Jersey during summer and off Florida during winter, with broad distribution along the coast during spring and fall. The majority of fishing gear interactions occurred with rod and reel, longline, and gillnet gears. Historic abundance trends from multiple sources support a significant decline in white shark abundance in the 1970s and 1980s, but there have been apparent increases in abundance since the 1990s when a variety of conservation measures were implemented. Though the white shark's inherent vulnerability to exploitation warrants continued protections, our results suggest a more optimistic outlook for the recovery of this iconic predator in the Atlantic.


Conflict of interest statement

Competing Interests: The authors have declared that no competing interests exist.

Figures

Figure 1
Figure 1. White shark lengths.
Length frequency of white sharks from the western North Atlantic (N  =  538). These data include lengths from accurately measured specimens (N = 279), as well as estimated lengths, rounded down to the nearest m.
Figure 2
Figure 2. White shark gear interactions.
Reported fishery-dependent and fishery-independent gear interactions with white sharks by life stage in the NWA, 1800–2009 (N = 390).
Figure 3
Figure 3. White shark seasonal distribution.
Distribution of white shark presence records (white circles) in the NWA during (a) winter, (b) spring, (c) summer, and (d) fall. Positions are overlaid on seasonal average SST conditions (1985–2001). The 200 m bathymetric contour is displayed to delineate the edge of the continental shelf. CC  =  Cape Cod, NYB  =  New York Bight, CH  =  Cape Hatteras, FL  =  Florida, GOM  =  Gulf of Mexico, and CS  =  Caribbean Sea.
Figure 4
Figure 4. White shark monthly distribution.
Box plots of latitudinal distribution of white shark presence by month in the NWA. The sample size in each month is given above the x-axis.
Figure 5
Figure 5. White shark habitat use.
Distribution of (a) bottom depths (N = 564) and (b) SST (N = 124) associated with NWA white shark captures/sightings.
Figure 6
Figure 6. White shark relative abundance.
White shark indices of abundance (index/mean) standardized using a zero-inflated Poisson model plotted by year for three time series: NEFSC LL  =  Northeast Fisheries Science Center fishery-independent longline surveys, TOURN  =  NEFSC tournament database, and OBS LL  =  observer program of the directed shark longline fishery. Trend lines are best fit regression models of the standardized data (second order polynomial for NEFSC LL and exponential for TOURN and OBS), using R2 values and considering the biology of the white shark. The dashed red line indicates the year of the first fishery management plan (FMP) for Atlantic sharks in 1993 and the solid red line indicates the year that white sharks were listed as a NMFS prohibited species in 1997 .
Figure 7
Figure 7. White shark relative abundance trend.
Time series of white shark relative abundance in the NWA as estimated from hierarchical analysis. The continuous black line gives the posterior mean, and the shaded area represents a 95% credible interval about the time series. The red line is the estimated trend based on locally weighted polynomial regression using the LOWESS smoother.
Figure 8
Figure 8. Time series of white shark sightings.
(a) Number of annual white shark sightings reported in the NWA from 1800 to 2009. (b) Estimates of relative change in abundance (filled circles) with 95% credible intervals (dashed lines) for any reference year between 1800 and 2008 assuming no change (black plot), a 50% increase (red plot), and a 50% decrease in observation effort. (c) Number of annual white shark sightings reported in the NWA from 1950 to 2009. (d) Estimates of relative change in abundance (filled circles) with 95% credible intervals (dashed lines) for any reference year between 1950 and 2009 assuming no change in observation effort (black plot), a 25% and 50% increase in observation effort (green and red plots, respectively), and a 25% and 50% decrease in observation effort (blue and purple plots, respectively).
Figure 9
Figure 9. White shark relative decline in abundance.
Estimates of relative decline in abundance (filled circles) with 95% credible intervals (dashed lines) for any reference year between 1960 and 1986 assuming no change in observation effort (black plot), a 25% and 50% increase in observation effort (green and red plots, respectively), and a 25% and 50% decrease in observation effort (blue and purple plots, respectively). Note that the scale for the y-axis has been reversed when compared to Figure 8 to visualize the declining trend in abundance during this time period.
Figure 10
Figure 10. Trend comparison of white shark relative abundance.
(a) Estimated trend from the hierarchical analysis, and (b) estimated trend from the sightings analysis.
Figure 11
Figure 11. Recent trends in white shark relative abundance.
Estimates of relative change in abundance (filled circles) with 95% credible intervals (dashed lines) for any reference year between 1990 and 2008 assuming no change in observation effort (black plot), a 25% and 50% increase in observation effort (green and red plots, respectively), and a 25% and 50% decrease in observation effort (blue and purple plots, respectively) for the original sightings time series from 1990 to 2009 (a) and the time series with sightings that occurred near Monomoy Island during that time frame removed (b).

References

    1. Compagno LJV (2001) Sharks of the world: an annotated and illustrated catalogue of shark species known to date. Vol. 2. Bullhead, mackerel, and carpet sharks (Heterodontiformes, Lamniformes and Orectolobiformes). FAO Species Catalogue for Fishery Purposes, No. 1, Vol. 2. Rome, FAO. 269 pp.
    1. Cortés E (1999) Standardized diet compositions and trophic levels of sharks. ICES J Mar Sci 56: 707–717.
    1. Estrada JA, Rice AN, Natanson LJ, Skomal GB (2006) Use of isotopic analysis of vertebrae in reconstructing ontogenetic feeding ecology in white sharks. Ecol 87(4): 829–834. - PubMed
    1. Smith SE, Au DW, Show C (1998) Intrinsic rebound potentials of 26 species of Pacific sharks. Mar Freshw Res 49: 663–678.
    1. Cortés E (2002) Incorporating uncertainty into demographic modeling: Application to shark populations and their conservation. Conserv Biol 16(4): 1048–1062.

LinkOut - more resources