

Phylogenetic stochastic mapping without matrix exponentiation
- PMID: 24918812
- PMCID: PMC4148059
- DOI: 10.1089/cmb.2014.0062
Phylogenetic stochastic mapping without matrix exponentiation
Abstract
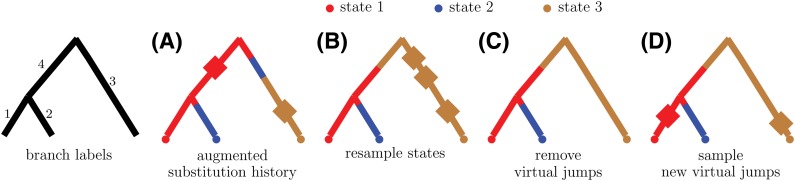
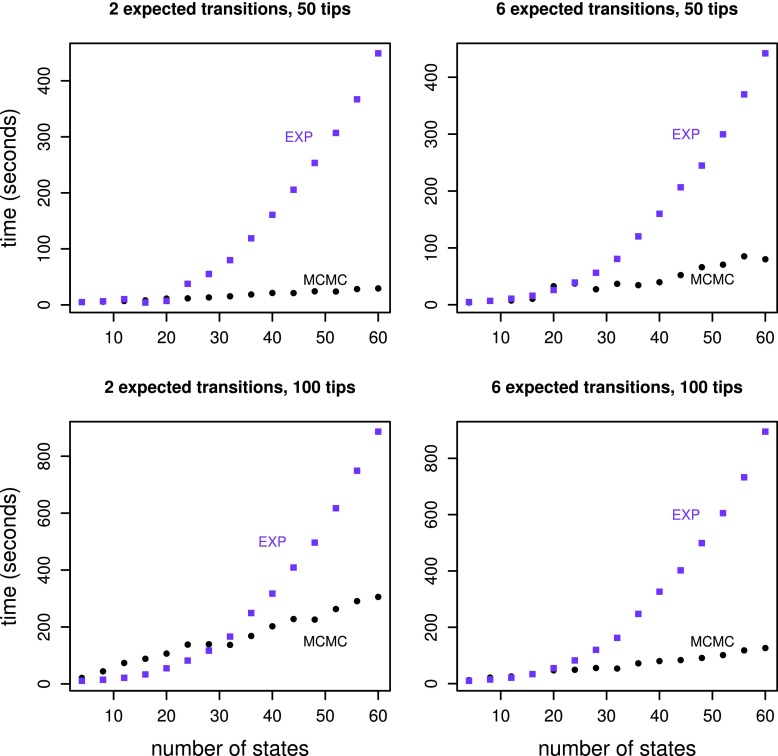
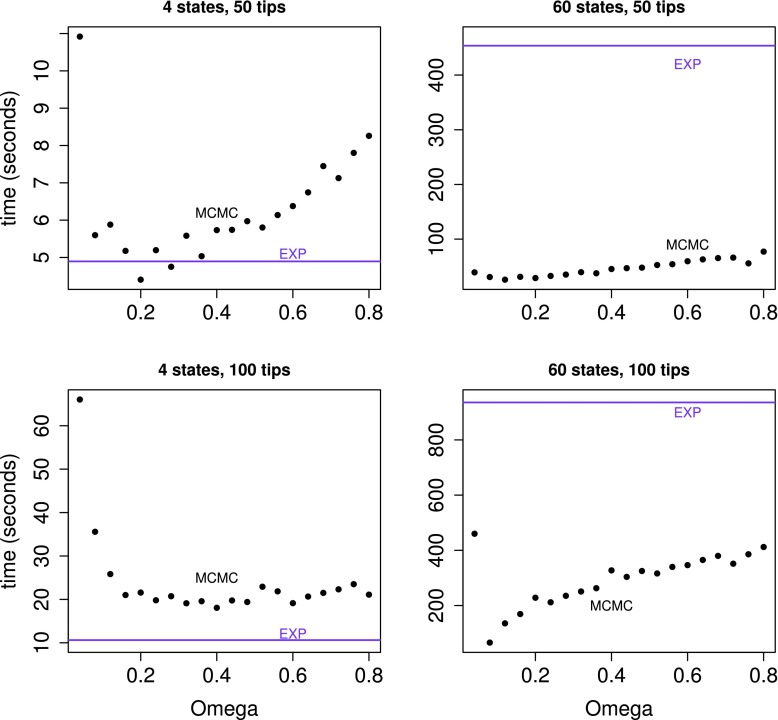
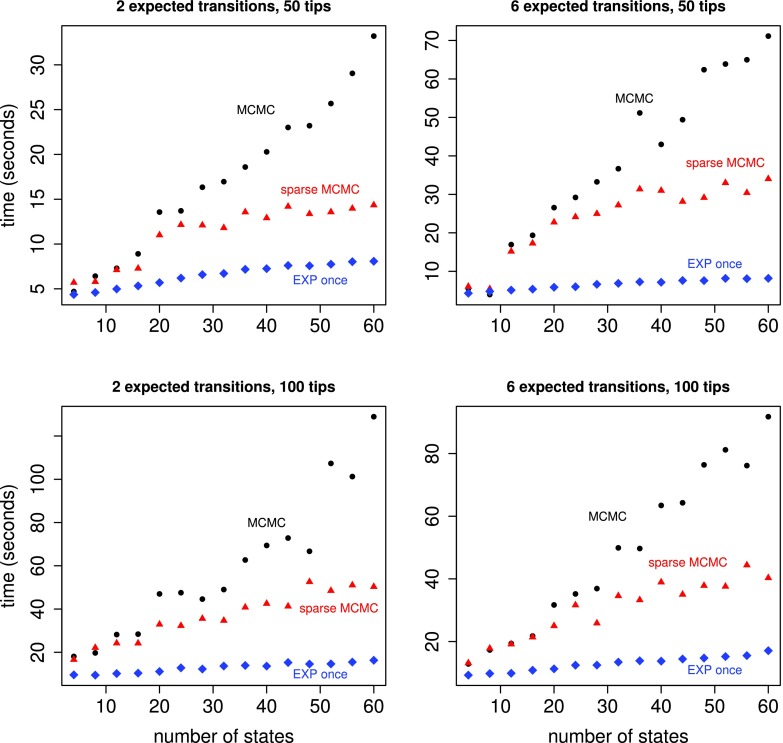
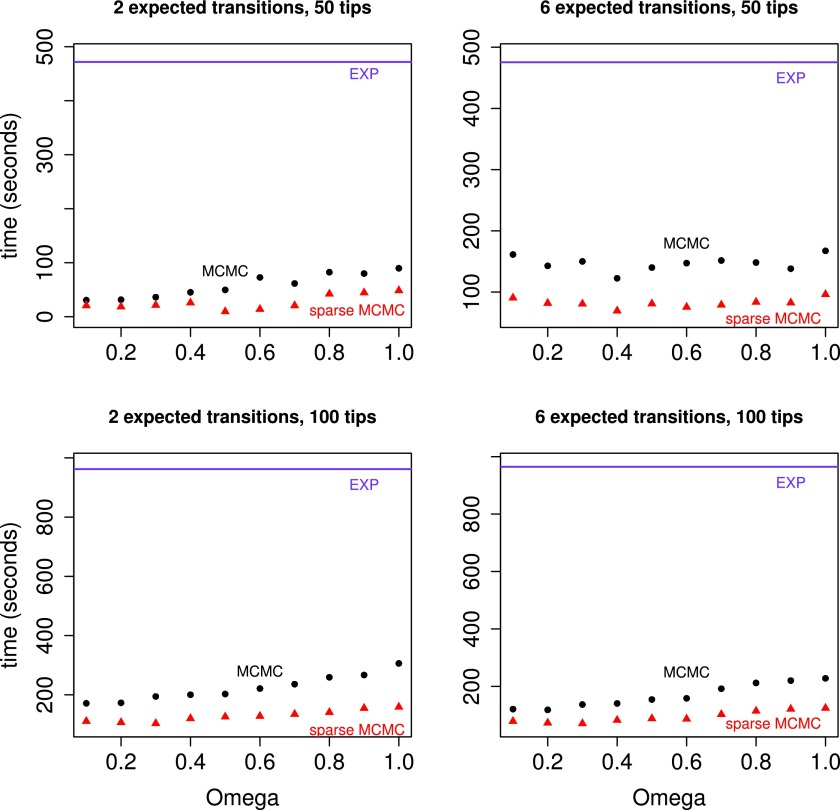
Phylogenetic stochastic mapping is a method for reconstructing the history of trait changes on a phylogenetic tree relating species/organism carrying the trait. State-of-the-art methods assume that the trait evolves according to a continuous-time Markov chain (CTMC) and works well for small state spaces. The computations slow down considerably for larger state spaces (e.g., space of codons), because current methodology relies on exponentiating CTMC infinitesimal rate matrices-an operation whose computational complexity grows as the size of the CTMC state space cubed. In this work, we introduce a new approach, based on a CTMC technique called uniformization, which does not use matrix exponentiation for phylogenetic stochastic mapping. Our method is based on a new Markov chain Monte Carlo (MCMC) algorithm that targets the distribution of trait histories conditional on the trait data observed at the tips of the tree. The computational complexity of our MCMC method grows as the size of the CTMC state space squared. Moreover, in contrast to competing matrix exponentiation methods, if the rate matrix is sparse, we can leverage this sparsity and increase the computational efficiency of our algorithm further. Using simulated data, we illustrate advantages of our MCMC algorithm and investigate how large the state space needs to be for our method to outperform matrix exponentiation approaches. We show that even on the moderately large state space of codons our MCMC method can be significantly faster than currently used matrix exponentiation methods.
Keywords: MCMC; codon models; data augmentation; evolution; uniformization.
Figures
Similar articles
-
Quantifying MCMC exploration of phylogenetic tree space.Syst Biol. 2015 May;64(3):472-91. doi: 10.1093/sysbio/syv006. Epub 2015 Jan 27. Syst Biol. 2015. PMID: 25631175 Free PMC article.
-
Monte Carlo estimation of total variation distance of Markov chains on large spaces, with application to phylogenetics.Stat Appl Genet Mol Biol. 2013 Mar 26;12(1):39-48. doi: 10.1515/sagmb-2012-0023. Stat Appl Genet Mol Biol. 2013. PMID: 23459470
-
Guided tree topology proposals for Bayesian phylogenetic inference.Syst Biol. 2012 Jan;61(1):1-11. doi: 10.1093/sysbio/syr074. Epub 2011 Aug 9. Syst Biol. 2012. PMID: 21828081
-
Sampling phylogenetic tree space with the generalized Gibbs sampler.Mol Phylogenet Evol. 2005 Mar;34(3):459-68. doi: 10.1016/j.ympev.2004.11.016. Epub 2005 Jan 8. Mol Phylogenet Evol. 2005. PMID: 15683921
-
Finding starting points for Markov chain Monte Carlo analysis of genetic data from large and complex pedigrees.Genet Epidemiol. 2003 Jul;25(1):14-24. doi: 10.1002/gepi.10243. Genet Epidemiol. 2003. PMID: 12813723 Review.
Cited by
-
Inferring Long-Term Effective Population Size with Mutation-Selection Models.Mol Biol Evol. 2021 Sep 27;38(10):4573-4587. doi: 10.1093/molbev/msab160. Mol Biol Evol. 2021. PMID: 34191010 Free PMC article.
-
chromploid: An R package for chromosome number evolution across the plant tree of life.Appl Plant Sci. 2018 Apr 11;6(3):e1037. doi: 10.1002/aps3.1037. eCollection 2018 Mar. Appl Plant Sci. 2018. PMID: 29732267 Free PMC article.
References
-
- Eddelbuettel D., and François R.2011. Rcpp: Seamless R and C++ integration. Journal of Statistical Software 40, 1–18
-
- Eddelbuettel D., and Sanderson C.2014. RcppArmadillo: Accelerating R with high-performance C++ linear algebra. Computational Statistics & Data Analysis 71, 1054–1063
MeSH terms
Substances
Grants and funding
LinkOut - more resources
Full Text Sources
Other Literature Sources