

Genomic and metabolomic profile associated to microalbuminuria
- PMID: 24918908
- PMCID: PMC4053470
- DOI: 10.1371/journal.pone.0098227
Genomic and metabolomic profile associated to microalbuminuria
Abstract
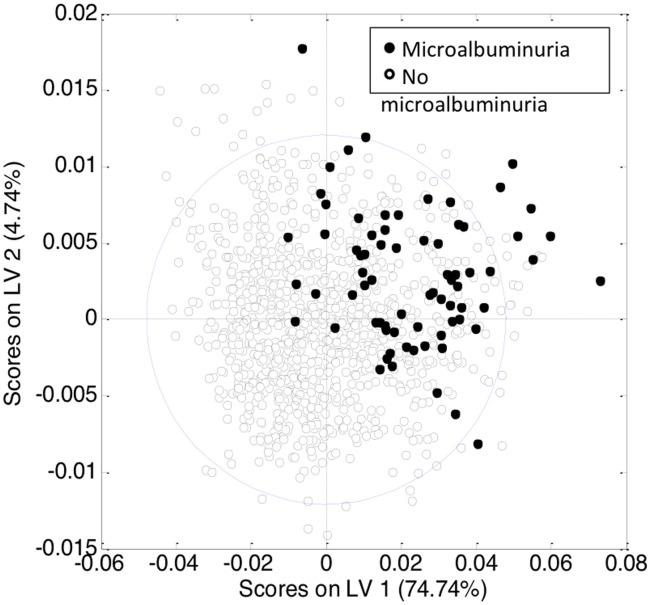
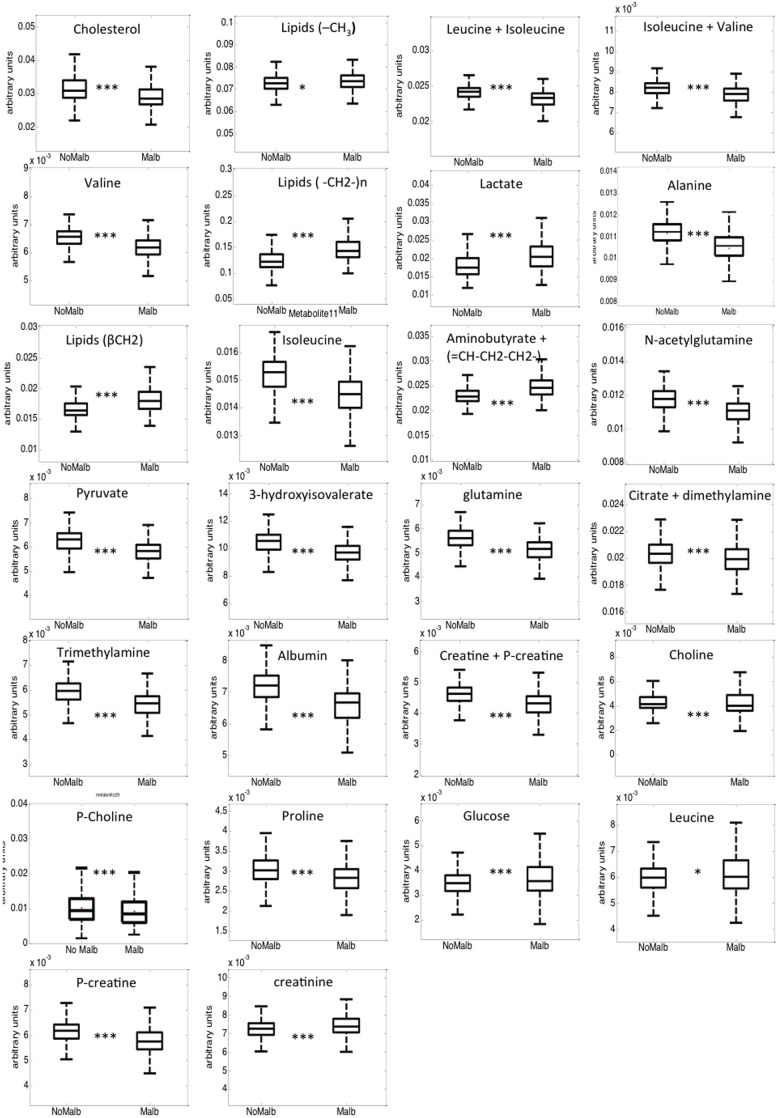
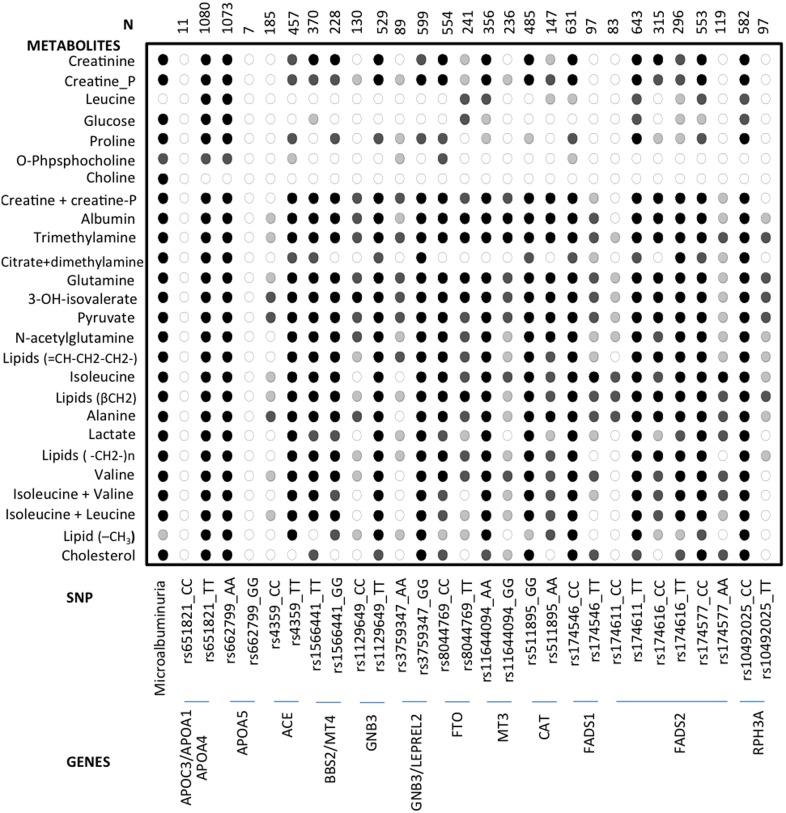
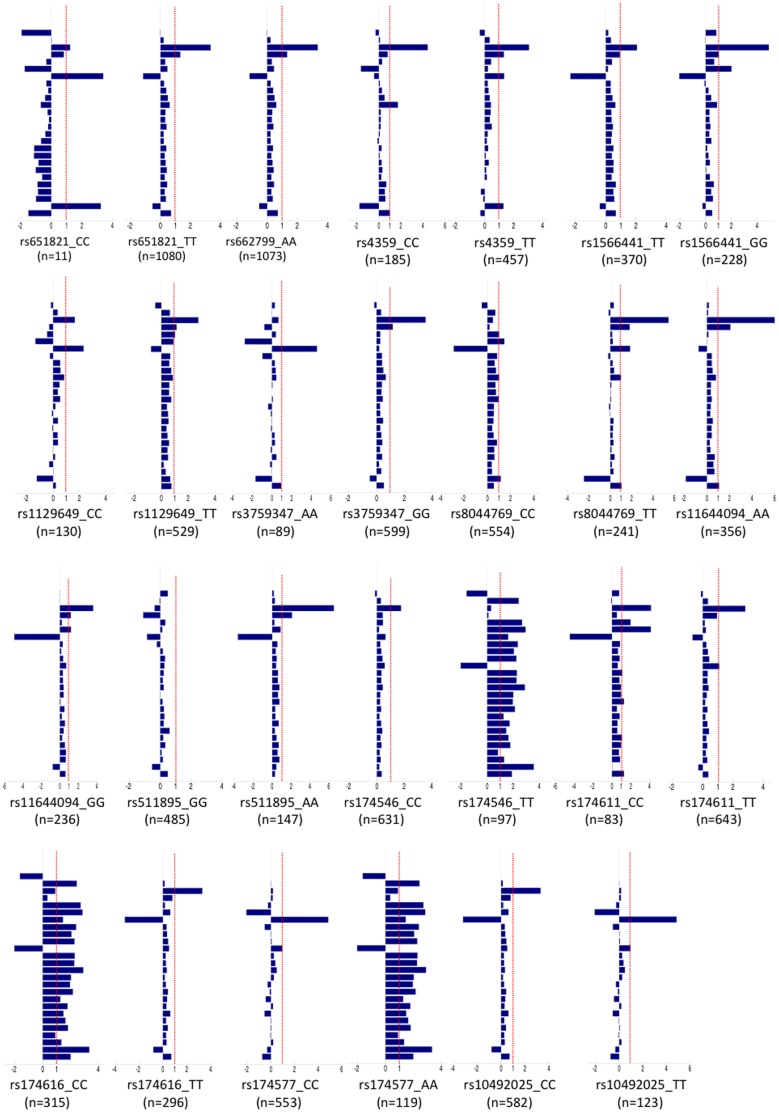
To identify factors related with the risk to develop microalbuminuria using combined genomic and metabolomic values from a general population study. One thousand five hundred and two subjects, Caucasian, more than 18 years, representative of the general population, were included. Blood pressure measurement and albumin/creatinine ratio were measured in a urine sample. Using SNPlex, 1251 SNPs potentially associated to urinary albumin excretion (UAE) were analyzed. Serum metabolomic profile was assessed by 1H NMR spectra using a Brucker Advance DRX 600 spectrometer. From the total population, 1217 (mean age 54 ± 19, 50.6% men, ACR>30 mg/g in 81 subjects) with high genotyping call rate were analysed. A characteristic metabolomic profile, which included products from mitochondrial and extra mitochondrial metabolism as well as branched amino acids and their derivative signals, were observed in microalbuminuric as compare to normoalbuminuric subjects. The comparison of the metabolomic profile between subjects with different UAE status for each of the genotypes associated to microalbuminuria revealed two SNPs, the rs10492025_TT of RPH3A gene and the rs4359_CC of ACE gene, with minimal or no statistically significant differences. Subjects with and without microalbuminuria, who shared the same genotype and metabolomic profile, differed in age. Microalbuminurics with the CC genotype of the rs4359 polymorphism and with the TT genotype of the rs10492025 polymorphism were seven years older and seventeen years younger, respectively as compared to the whole microalbuminuric subjects. With the same metabolomic environment, characteristic of subjects with microalbuminuria, the TT genotype of the rs10492025 polymorphism seems to increase and the CC genotype of the rs4359 polymorphism seems to reduce risk to develop microalbuminuria.
Conflict of interest statement
Figures
Similar articles
-
Genomic and Metabolomic Profile Associated to Clustering of Cardio-Metabolic Risk Factors.PLoS One. 2016 Sep 2;11(9):e0160656. doi: 10.1371/journal.pone.0160656. eCollection 2016. PLoS One. 2016. PMID: 27589269 Free PMC article.
-
Angiotensinogen T235 and ACE insertion/deletion polymorphisms associated with albuminuria in Chinese type 2 diabetic patients.Diabetes Care. 1998 Mar;21(3):431-7. doi: 10.2337/diacare.21.3.431. Diabetes Care. 1998. PMID: 9540028
-
Influence of the I/D polymorphism of the angiotensin-converting enzyme gene on the outcome of microalbuminuria in essential hypertension.Hypertension. 2000 Jan;35(1 Pt 2):490-5. doi: 10.1161/01.hyp.35.1.490. Hypertension. 2000. PMID: 10642347
-
The deletion polymorphism of the angiotensin I-converting enzyme gene is associated with target organ damage in essential hypertension.J Am Soc Nephrol. 1996 Dec;7(12):2550-8. doi: 10.1681/ASN.V7122550. J Am Soc Nephrol. 1996. PMID: 8989733
-
Angiotensin II AT1 receptor gene polymorphism and microalbuminuria in essential hypertension.Am J Hypertens. 2001 Apr;14(4 Pt 1):364-70. doi: 10.1016/s0895-7061(00)01284-x. Am J Hypertens. 2001. PMID: 11336183
Cited by
-
Rabphilin involvement in filtration and molecular uptake in Drosophila nephrocytes suggests a similar role in human podocytes.Dis Model Mech. 2020 Sep 21;13(9):dmm041509. doi: 10.1242/dmm.041509. Dis Model Mech. 2020. PMID: 32680845 Free PMC article.
-
Rabphilin silencing causes dilated cardiomyopathy in a Drosophila model of nephrocyte damage.Sci Rep. 2021 Jul 27;11(1):15287. doi: 10.1038/s41598-021-94710-7. Sci Rep. 2021. PMID: 34315987 Free PMC article.
-
Cohort profile: the Hortega Study for the evaluation of non-traditional risk factors of cardiometabolic and other chronic diseases in a general population from Spain.BMJ Open. 2019 Jun 27;9(6):e024073. doi: 10.1136/bmjopen-2018-024073. BMJ Open. 2019. PMID: 31248913 Free PMC article.
-
Multivariate canonical correlation analysis identifies additional genetic variants for chronic kidney disease.NPJ Syst Biol Appl. 2024 Mar 9;10(1):28. doi: 10.1038/s41540-024-00350-8. NPJ Syst Biol Appl. 2024. PMID: 38459044 Free PMC article.
-
The Rab-Rabphilin system in injured human podocytes stressed by glucose overload and angiotensin II.Am J Physiol Renal Physiol. 2020 Aug 1;319(2):F178-F191. doi: 10.1152/ajprenal.00077.2020. Epub 2020 Jun 22. Am J Physiol Renal Physiol. 2020. PMID: 32567349 Free PMC article.
References
-
- Pedrinelli R, Dell’Omo G, Di Bello V, Pontremoli R, Mariani M (2002) Microalbuminuria, an integrated marker of cardiovascular risk in essential hypertension. J Hum Hypertens 16: 79–89. - PubMed
-
- Feldt-Rasmussen B (2000) Microalbuminuria, endothelial dysfunction and cardiovascular risk. Diabetes Metab 26: 64–66. - PubMed
-
- Mancia G, Fagard R, Narkiewicz K, Redón J, Zanchetti A, et al. (2013) 2013 ESH/ESC Guidelines for the management of arterial hypertension: The Task Force for the management of arterial hypertension of the European Society of Hypertension (ESH) and of the European Society of Cardiology (ESC). J Hypertens 31: 1281–1357. - PubMed
-
- Redon J, Pascual JM (2006) Development of microalbuminuria in essential hypertension. Curr Hypertens Rep 8: 171–177. - PubMed
Publication types
MeSH terms
Substances
LinkOut - more resources
Full Text Sources
Other Literature Sources
Miscellaneous
