

doi: 10.1038/nature13444.
Epub 2014 Jun 11.
Inactivation of PI(3)K p110δ breaks regulatory T-cell-mediated immune tolerance to cancer
Affiliations
- PMID: 24919154
- PMCID: PMC4501086
- DOI: 10.1038/nature13444
Item in Clipboard
Inactivation of PI(3)K p110δ breaks regulatory T-cell-mediated immune tolerance to cancer
Nature.
.
Erratum in
-
Corrigendum: Inactivation of PI(3)K p110δ breaks regulatory T-cell-mediated immune tolerance to cancer.Nature. 2016 Jul 28;535(7613):580. doi: 10.1038/nature17641. Epub 2016 Apr 6. Nature. 2016. PMID: 27049952 No abstract available.
Abstract
Inhibitors against the p110δ isoform of phosphoinositide-3-OH kinase (PI(3)K) have shown remarkable therapeutic efficacy in some human leukaemias. As p110δ is primarily expressed in leukocytes, drugs against p110δ have not been considered for the treatment of solid tumours. Here we report that p110δ inactivation in mice protects against a broad range of cancers, including non-haematological solid tumours. We demonstrate that p110δ inactivation in regulatory T cells unleashes CD8(+) cytotoxic T cells and induces tumour regression. Thus, p110δ inhibitors can break tumour-induced immune tolerance and should be considered for wider use in oncology.
Figures
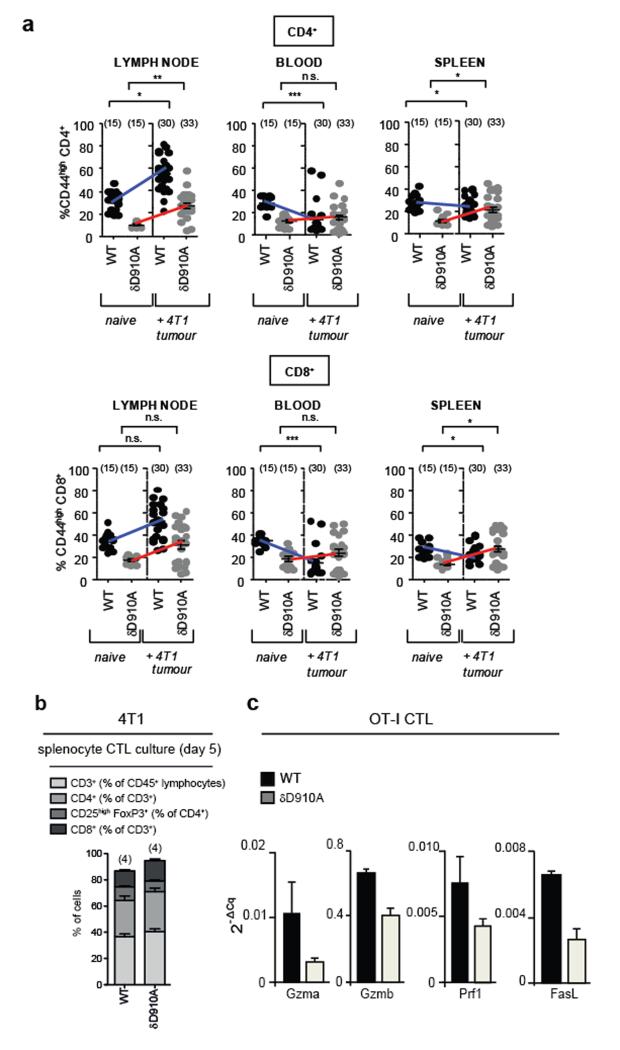
a, Levels of CD44highCD4+ and CD44highCD8+ T cells in the indicated immune compartments of naive and 4T1 tumour-bearing on day 26 after inoculation in WT or δD910A mice. b, Distribution of cells on day 5 of culture of splenocytes, isolated from 4T1 tumour-bearing WT and δD910A mice 21 days after inoculation, in the presence of mitomycin-treated 4T1 cells. c, Gene expression in CTLs derived from splenocytes from WT and δD910A OT-I mice, cultured in the presence of SIINFEKL OVA peptide and IL2. GzmA, granzyme A; GzmB, granzyme B, Prf1, perforin and (FasL or CD95L) Fas ligand. Expression levels are presented relative to β2-microglobulin. a-b, Statistically significant differences are indicated by * (P < 0.05) or ** (P < 0.01), as determined by the non-parametric Mann-Whitney t test. Between brackets: number of mice used per experiment. Each dot represents an individual mouse.
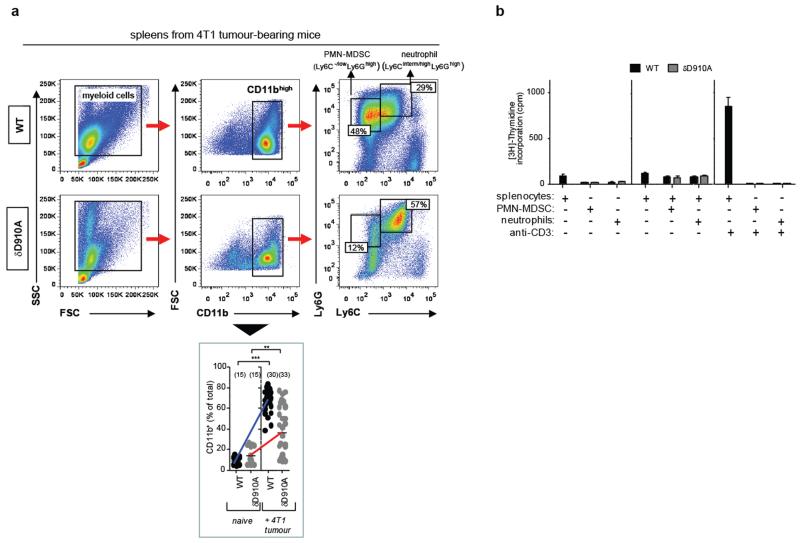
a, Gating strategy used to identify myeloid cell subsets. Splenic cells were gated on CD11bhigh cells followed by Ly6C and Ly6G gating. FSC, forward scatter; SSC, side scatter (top panel). Frequency of CD11b+ cells in the spleen of WT and δD910A naïve mice and in 4T1 tumour-bearing mice on day 21 after inoculation (bottom panel). b, [3H]-Thymidine incorporation in co-cultures of splenocytes and purified myeloid cells, in combinations as indicated, with or without stimulation with anti-CD3 antibodies. Cultures were made using cells derived from individual mice. Error bars represent standard deviation from the mean of biological replicates. Statistically significant differences are indicated by * (P < 0.05) or ** (P < 0.01), as determined by the non-parametric Mann-Whitney t test. Between brackets: number of mice used per experiment. Each dot represents an individual mouse.
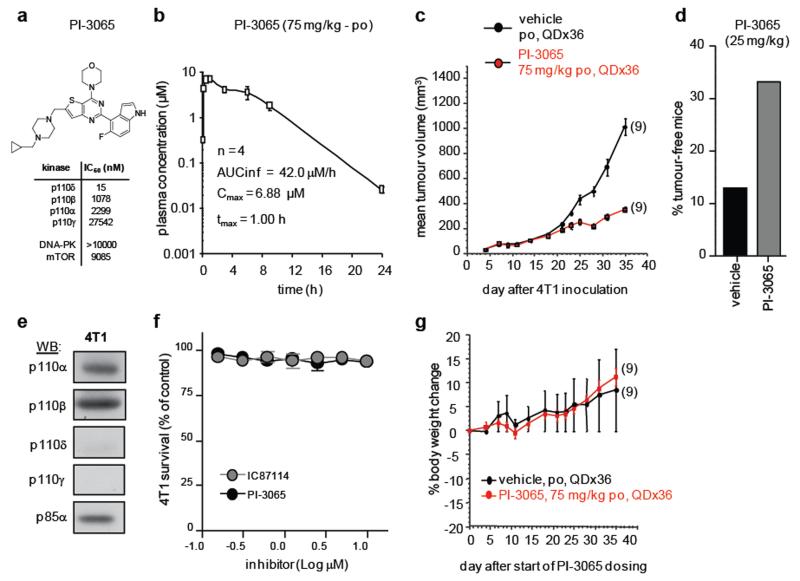
a, PI-3065 structure and in vitro IC50 on selected PI3K family members. No significant activity against 72 protein kinases was observed at ≤ 10 μM in a KinaseProfiler assay (Millipore). b, Pharmacokinetic parameters of PI-3065. Mean (±SD) plasma concentration profile of PI-3065 following a single oral dose (75 mg/kg) administred per os (po) to female BALB/c mice. AUCinf, area under the curve, extrapolated to infinity; Cmax, highest observed plasma concentration; tmax, time at which Cmax occurred, QD; quaque die, every day. c, Growth of primary 4T1 tumours, inoculated in the breast fat pad, measured by calipers and expressed as tumour volume. Mice were dosed per os with vehicle or PI-3065 (75 mg/kg, daily) for 36 days. 105 tumour cells were inoculated 12 h post first dosing. d, Percentage of tumour-free mice upon continuous per os treatment of mice with vehicle or PI-3065 (25 mg/kg, twice daily) for 37 days, with tumour cells inoculated on day 7 of PI-3065 dosing. 15 mice were used for each genotype. e, Class I PI3K isoform expression in 4T1 cells. f, Proliferation of 4T1 cells following a 4 h treatment with the indicated p110δ inhibitors, washing and MTS staining after 48 h culture. g, Percentage body weight change (from day 0) of 4T1 tumour-bearing mice upon daily per os administration of PI-3065 (75 mg/kg) or vehicle for 36 consecutive days. Statistically significant differences are indicated by * (P < 0.05) or ** (P < 0.01), as determined by the non-parametric Mann-Whitney t test. Between brackets: number of mice used per experiment.
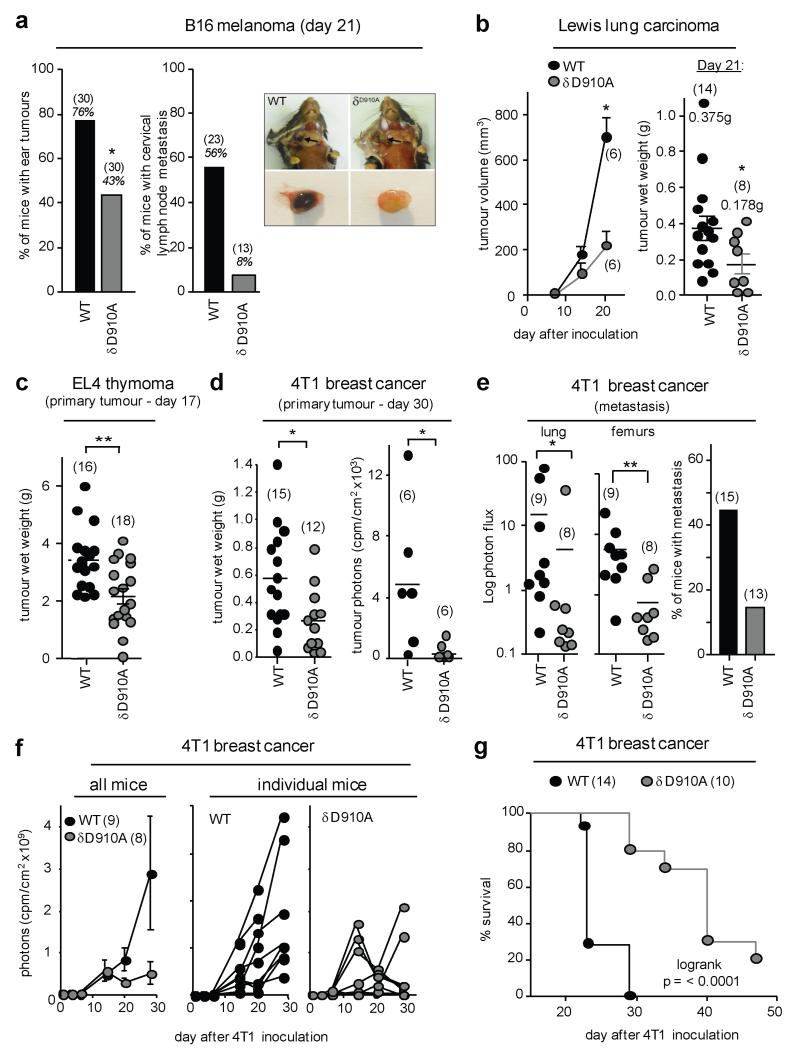
a, percentage of mice with visible B16 ear tumours (left) or lymph nodes metastasis (right). Photographs show B16 metastases in cervical lymph nodes and representative excised lymph nodes. b-d, primary tumour burden of the indicated tumour lines. e, 4T1 metastasis as detected by luciferase activity (left and middle panel) or histology (right panel), expressed as a percentage of the total number of tumour-bearing animals/group. f, Growth of primary 4T1 tumours. g, Survival of 4T1 tumour-bearing mice. a-f, Statistically significant differences are indicated by * (P < 0.05) or ** (P < 0.01), as determined by the non-parametric Mann-Whitney t test. Between brackets: number of mice used per experiment. Each dot represents an individual mouse.
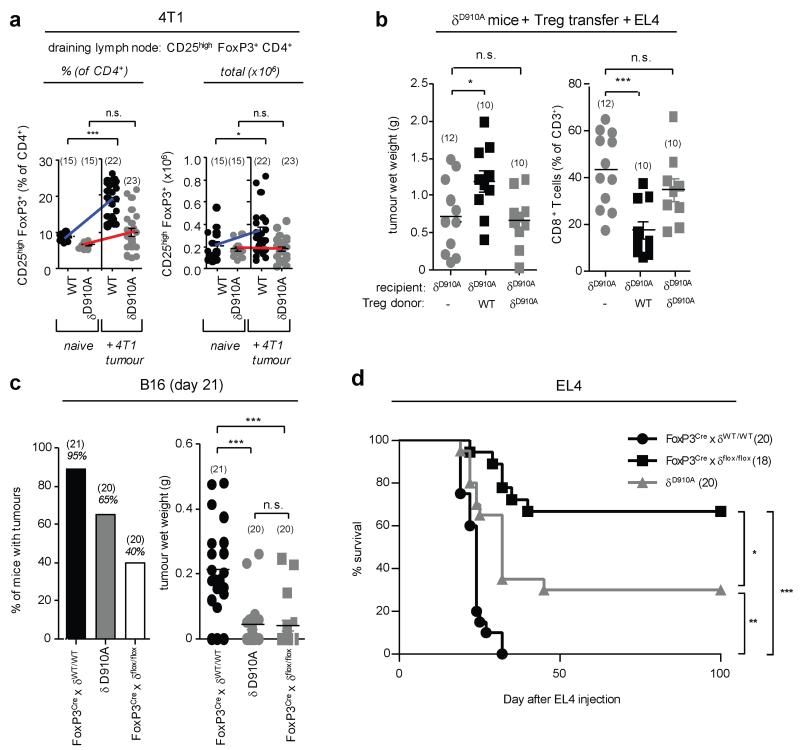
a, Relative and total numbers of Treg in the draining lymph nodes of naive and 4T1 tumour-bearing mice. b, Impact of adoptive transfer of Treg into δD910A mice on EL4 tumour wet weight and tumour-infiltrating CD8+ T cells. c, Number of mice with visible B16 tumours and B16 tumour weight in mice of the indicated genotype. d, Survival of EL4 tumour-bearing mice of the indicated genotype. a-c, Statistically significant differences are indicated by * (P<0.05) or ** (P<0.01), as determined by the non-parametric Mann-Whitney t test or Anova. Between brackets: number of mice used per experiment. Each dot represents an individual mouse.
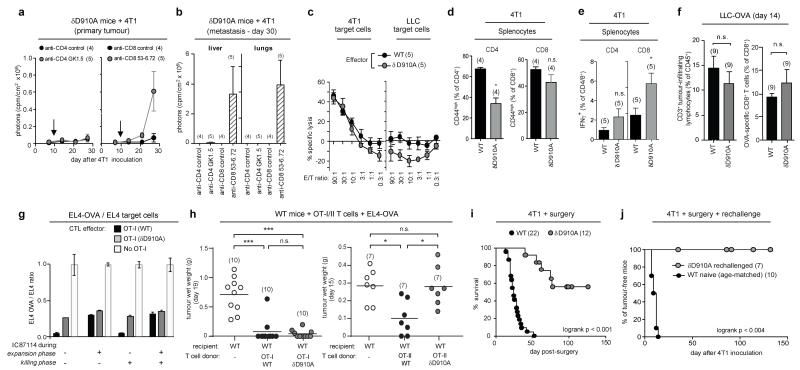
a, Growth of 4T1 in δD910A mice injected with antibodies to CD4 or CD8. Arrow indicates the time of antibody injection. b, Metastasis in CD4 or CD8 T cell-depleted 4T1 tumour-bearing δD910A mice. c, In vitro cytotoxic activity of splenocytes, isolated from 4T1 tumour-bearing WT and δD910A mice 21 days after inoculation and cultured for 4 days with mitomycin-treated 4T1 cells. E/T, effector to target (4T1 or LLC) ratio. d, Frequency of CD44high CD4+ and CD8+ T cells in splenocytes from 4T1 tumour-bearing mice cultured for 5 days with mitomycin-treated 4T1 cells. e, Frequency of IFNγ+ T cells after 16h PMA+ionomycin stimulation of splenocytes from WT and δD910A 4T1 tumour-bearing mice. f, Relative levels of tumour-infiltrating CD3+ lymphocytes and OVA-specific CD8+ T cells in LLC-OVA tumours in WT or δD910A mice. g, In vitro cell killing of a 1:1 EL4-OVA:EL4 mix following 24h incubation with CTL from WT or a δD910A OT-I mice (at an E/T ratio of 10:1), incubated with or without the p110δ inhibitor IC87114 during the 8 day expansion phase, the 24h killing phase, or both. Cell killing efficiency is expressed as the ratio of EL4-OVA cells over EL4 cells remaining after incubation with effector cells. h, Effect of adoptive transfer in WT mice of OT-I CD8+ or OT-II CD4+ cells on growth of subsequently inoculated EL4-OVA. i, Survival of post-surgical 4T1 tumour-bearing mice. j, Survival of δD910A mice which had remained tumour-free >200 days after surgery, and of naïve WT mice, following injection of 10,000 4T1 cells. Statistics are as described in the legend to Figure 1.
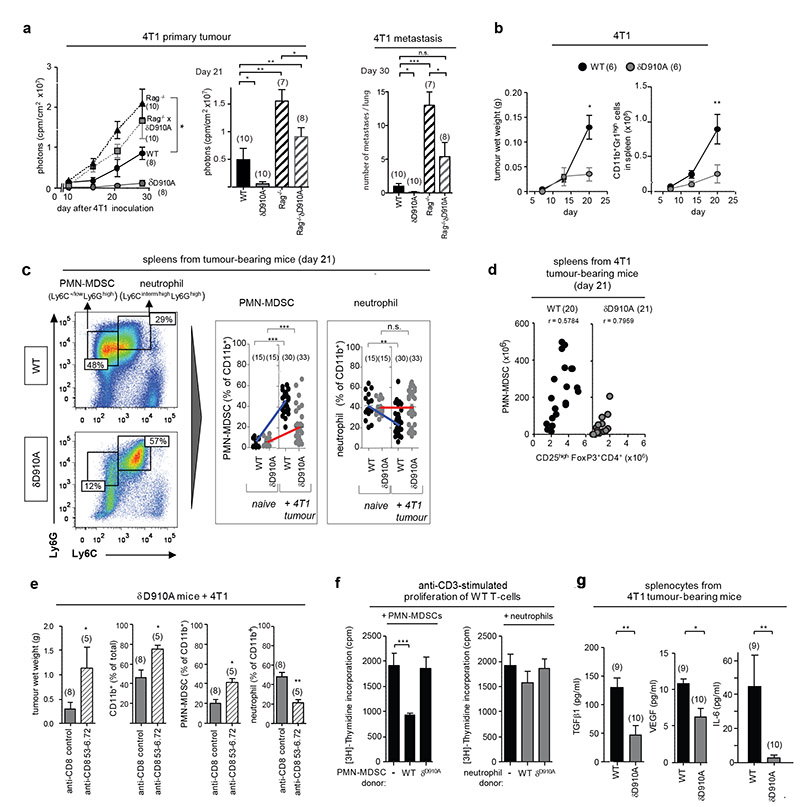
a, 4T1 primary tumour growth and lung metastasis in WT, δD910A, Rag−/− and Rag−/− xδD910A mice. b, 4T1 tumour growth and total numbers of splenic CD11b+Gr1high myeloid cells in WT and δD910A mice. c, Gating strategy used to identify myeloid cell subsets and frequency of splenic PMN-MDSCs and neutrophils of naïve and 4T1 tumour-bearing WT and δD910A mice. d, Spearman correlation between accumulation of splenic PMN-MDSCs and Treg in WT or δD910A mice. e, Impact of depleting CD8+ T cells in δD910A mice on 4T1 tumour burden and presence of splenic myeloid cell populations. f, Impact of purified splenic myeloid cells on proliferation of anti-CD3-stimulated WT T cells. g, Cytokine production by splenocytes from 4T1 tumour-bearing (30 days after inoculation) from WT or δD910A mice, individually cultured for 4 days. Statistics are as described in the legend to Figure 1.
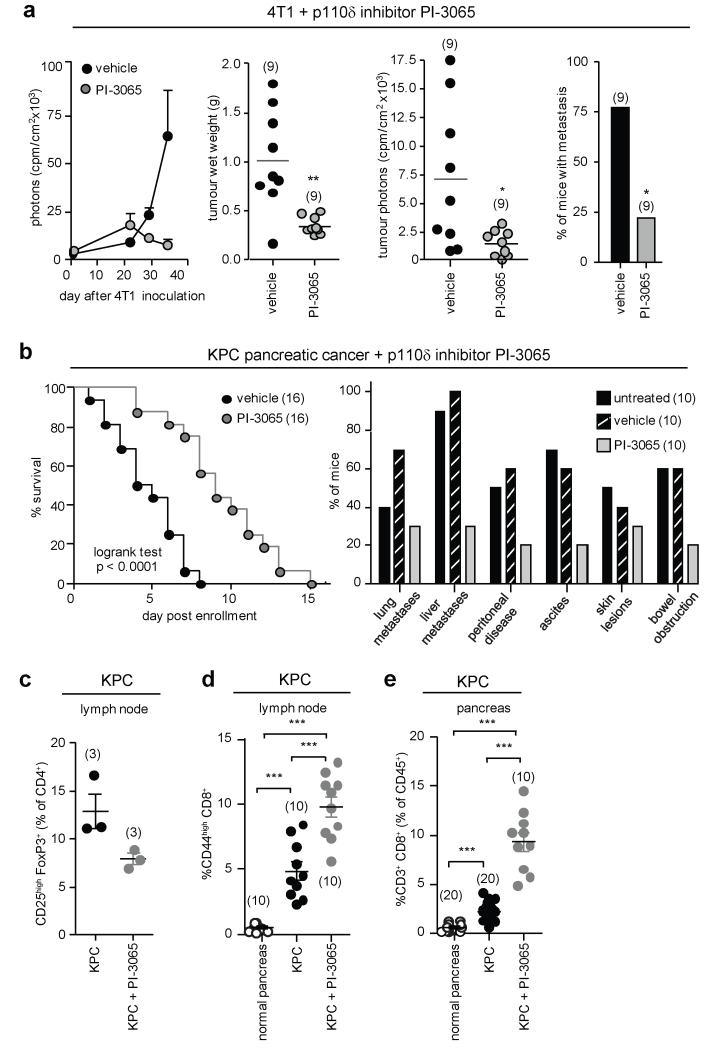
a, Mice, dosed with vehicle or PI-3065 (75 mg/kg, daily) for 36 days and inoculated with 105 4T1 cells 12h post first dosing, were assessed for tumour growth by luciferase imaging (first panel), tumour weight (second panel) or luciferase activity in tumours excised 35 days after inoculation (third panel). Incidence of 4T1 metastasis (fourth panel), as detected by H&E staining and histology, expressed as percentage of the total number of tumour-bearing animals per group. b, Impact of PI-3065 (75 mg/kg) on KPC mouse survival (left) and macrometastases (as detected by H&E staining) and cancer-associated pathology (right). c, Proportion of Treg (% of CD4+) in the draining lymph nodes of KPC mice administered vehicle or PI-3065. d, Proportion of CD44high T cells (% of CD8+) in the draining lymph nodes of KPC mice administered vehicle or PI-3065. e, Relative numbers of CD8+ T cells (% of CD45+) in normal pancreas and PDAC lesions of KPC mice treated or not with PI-3065. Statistics are as described in the legend to Figure 1.
Comment in
-
Cancer: natural-born killers unleashed.Nature. 2014 Jun 19;510(7505):342-3. doi: 10.1038/nature13503. Epub 2014 Jun 11. Nature. 2014. PMID: 24919150 No abstract available.
-
Immunotherapy: PI3Kδ inhibition lifts the breaks on antitumour immunity.Nat Rev Clin Oncol. 2014 Aug;11(8):442. doi: 10.1038/nrclinonc.2014.112. Epub 2014 Jul 1. Nat Rev Clin Oncol. 2014. PMID: 24981255 No abstract available.
-
Anticancer drugs: horizons broaden for PI3Kδ inhibitors.Nat Rev Drug Discov. 2014 Aug;13(8):573. doi: 10.1038/nrd4399. Nat Rev Drug Discov. 2014. PMID: 25082283 No abstract available.
References
-
- Murray JM, et al. Potent and highly selective benzimidazole inhibitors of PI3-kinase delta. Journal of medicinal chemistry. 2012;55:7686–7695. - PubMed
-
- Safina BS, et al. Discovery of novel PI3-kinase delta specific inhibitors for the treatment of rheumatoid arthritis: taming CYP3A4 time-dependent inhibition. Journal of medicinal chemistry. 2012;55:5887–5900. - PubMed
Publication types
MeSH terms
Substances
Grants and funding
- A10200/CRUK_/Cancer Research UK/United Kingdom
- 095691/WT_/Wellcome Trust/United Kingdom
- G0901338/MRC_/Medical Research Council/United Kingdom
- C23338/A10200/CRUK_/Cancer Research UK/United Kingdom
- MC_UP_1502/1/MRC_/Medical Research Council/United Kingdom
- C18270/A12888/CRUK_/Cancer Research UK/United Kingdom
- A12888/CRUK_/Cancer Research UK/United Kingdom
- 14355/CRUK_/Cancer Research UK/United Kingdom
- BBS/E/B/000C0407/BB_/Biotechnology and Biological Sciences Research Council/United Kingdom
- BB/E009867/1/BB_/Biotechnology and Biological Sciences Research Council/United Kingdom
- 12888/CRUK_/Cancer Research UK/United Kingdom
- C23338/A15965/CRUK_/Cancer Research UK/United Kingdom
- 15965/CRUK_/Cancer Research UK/United Kingdom
- A15965/CRUK_/Cancer Research UK/United Kingdom
- BBS/B/02010/BB_/Biotechnology and Biological Sciences Research Council/United Kingdom
- 095691/Z/11/Z/WT_/Wellcome Trust/United Kingdom
LinkOut - more resources
Full Text Sources
Other Literature Sources
Molecular Biology Databases
Research Materials
Miscellaneous
