

National economic development and disparities in body mass index: a cross-sectional study of data from 38 countries
- PMID: 24919199
- PMCID: PMC4053361
- DOI: 10.1371/journal.pone.0099327
National economic development and disparities in body mass index: a cross-sectional study of data from 38 countries
Abstract
Background: Increases in body mass index (BMI) and the prevalence of overweight in low- and middle income countries (LMICs) are often ascribed to changes in global trade patterns or increases in national income. These changes are likely to affect populations within LMICs differently based on their place of residence or socioeconomic status (SES).
Objective: Using nationally representative survey data from 38 countries and national economic indicators from the World Bank and other international organizations, we estimated ecological and multilevel models to assess the association between national levels of gross domestic product (GDP), foreign direct investment (FDI), and mean tariffs and BMI.
Design: We used linear regression to estimate the ecological association between average annual change in economic indicators and BMI, and multilevel linear or ordered multinomial models to estimate associations between national economic indicators and individual BMI or over- and underweight. We also included cross-level interaction terms to highlight differences in the association of BMI with national economic indicators by type of residence or socioeconomic status (SES).
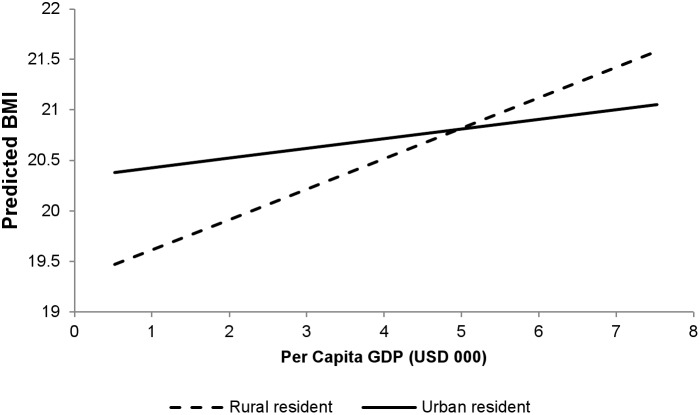
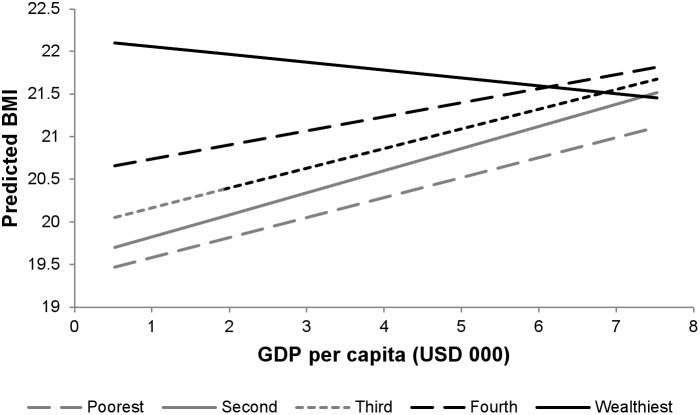
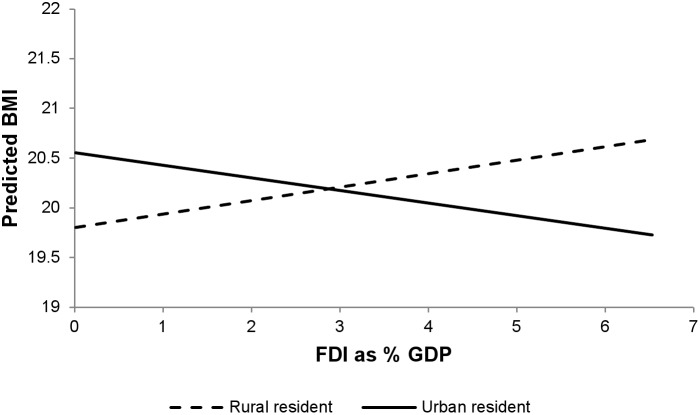
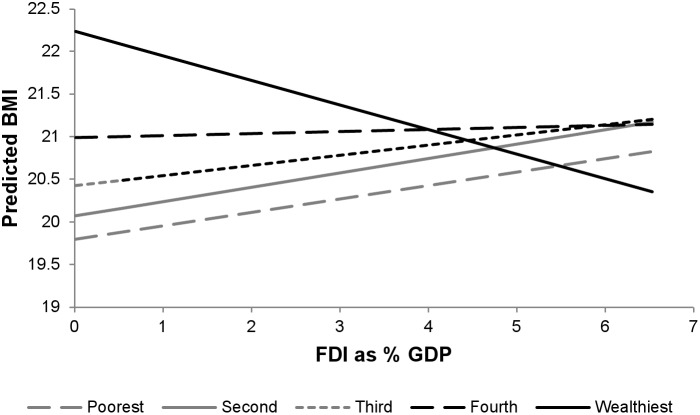
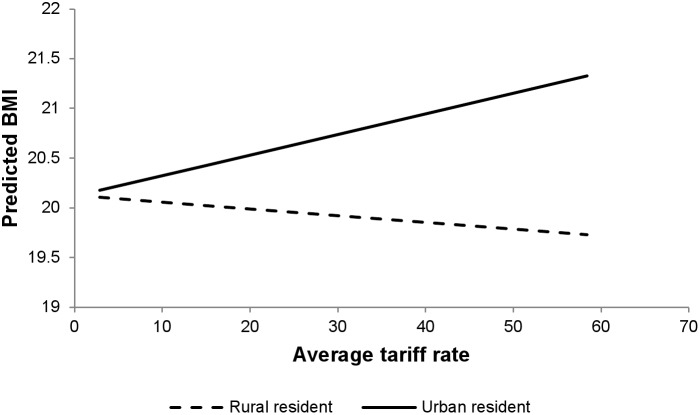
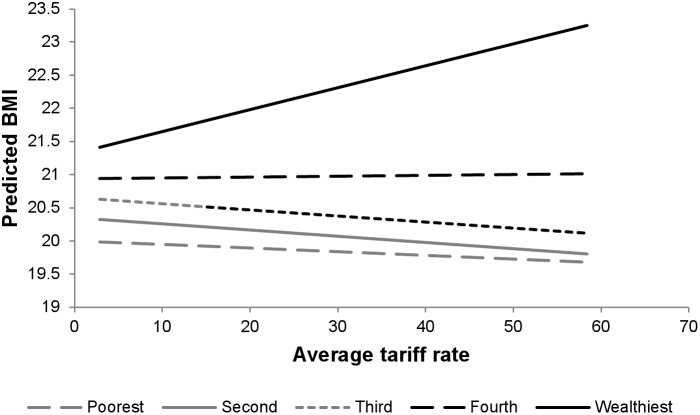
Results: There was a positive but non-significant association of GDP and mean BMI. This positive association of GDP and BMI was greater among rural residents and the poor. There were no significant ecological associations between measures of trade openness and mean BMI, but FDI was positively associated with BMI among the poorest respondents and in rural areas and tariff levels were negatively associated with BMI among poor and rural respondents.
Conclusion: Measures of national income and trade openness have different associations with the BMI across populations within developing countries. These divergent findings underscore the complexity of the effects of development on health and the importance of considering how the health effects of "globalizing" economic and cultural trends are modified by individual-level wealth and residence.
Conflict of interest statement
Figures
References
-
- Sobal J, Stunkard AJ (1989) Socioeconomic status and obesity: a review of the literature. Psychol Bull 105: 260–275. - PubMed
-
- Prentice AM (2006) The emerging epidemic of obesity in developing countries. Int J Epidemiol 35: 93–99. - PubMed
-
- Hossain P, Kawar B, El Nahas M (2007) Obesity and diabetes in the developing world–a growing challenge. N Engl J Med 356: 213–215. - PubMed
-
- Kelly T, Yang W, Chen CS, Reynolds K, He J (2008) Global burden of obesity in 2005 and projections to 2030. Int J Obes (Lond) 32: 1431–1437. - PubMed
-
- Wang H, Du S, Zhai F, Popkin BM (2007) Trends in the distribution of body mass index among Chinese adults, aged 20–45 years (1989–2000). Int J Obes (Lond) 31: 272–278. - PubMed
Publication types
MeSH terms
Grants and funding
LinkOut - more resources
Full Text Sources
Other Literature Sources
