. 2014 Aug;137(Pt 8):2231-44.
doi: 10.1093/brain/awu149. Epub 2014 Jun 11.

High frequency oscillations are associated with cognitive processing in human recognition memory

Affiliations

High frequency oscillations are associated with cognitive processing in human recognition memory

Michal T Kucewicz et al. Brain. 2014 Aug.

Abstract

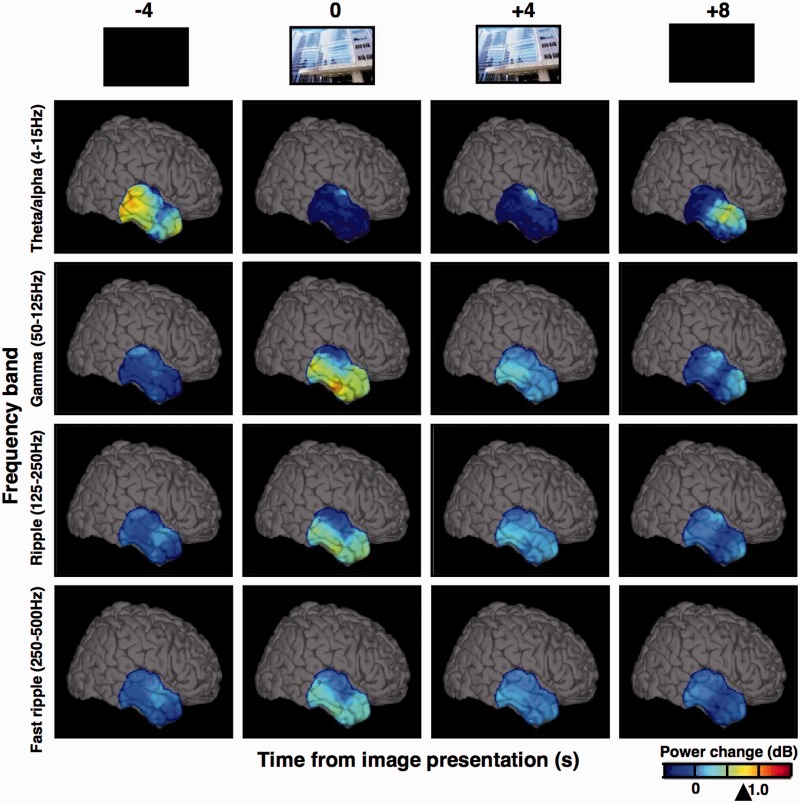
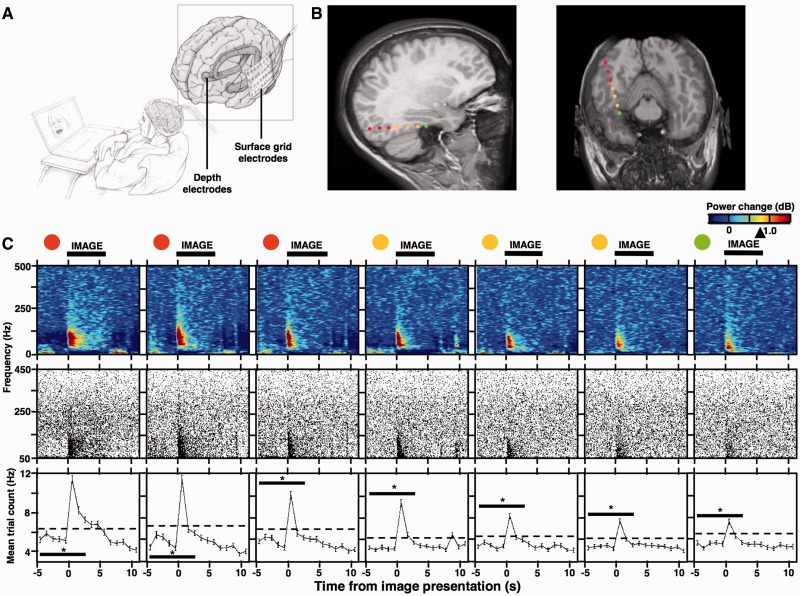
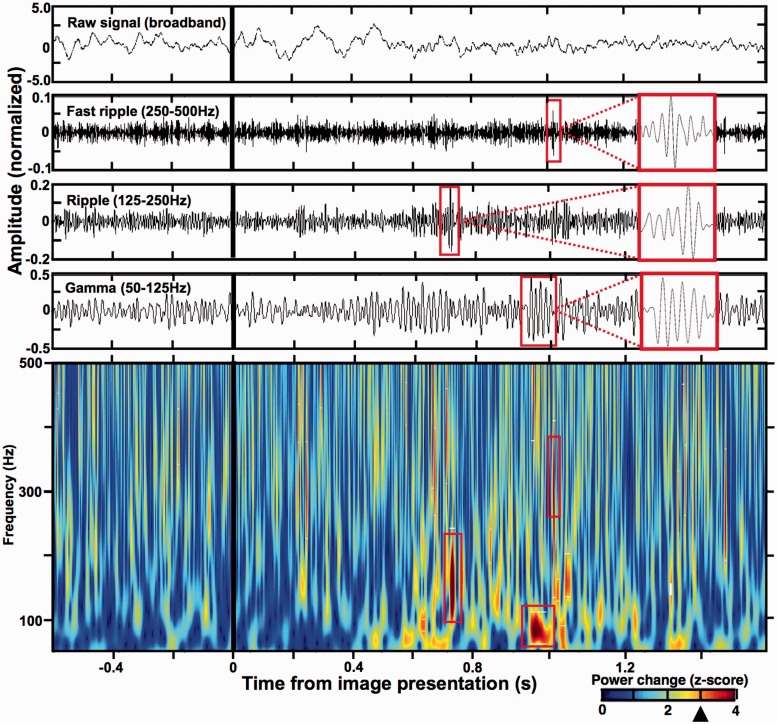
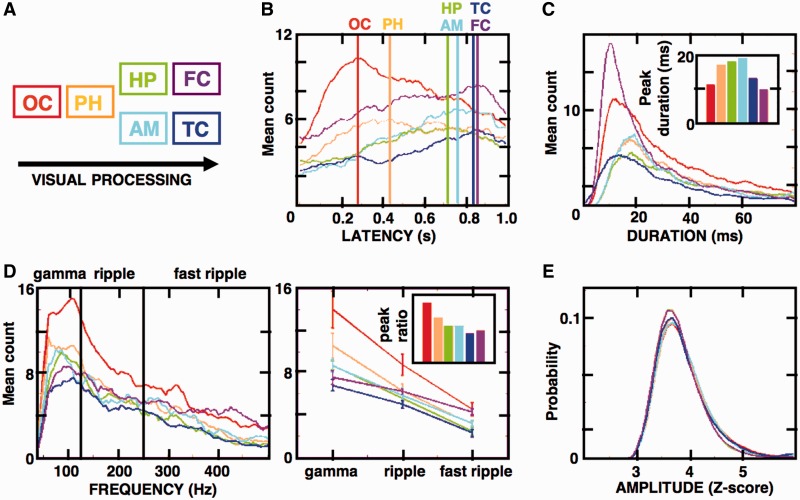
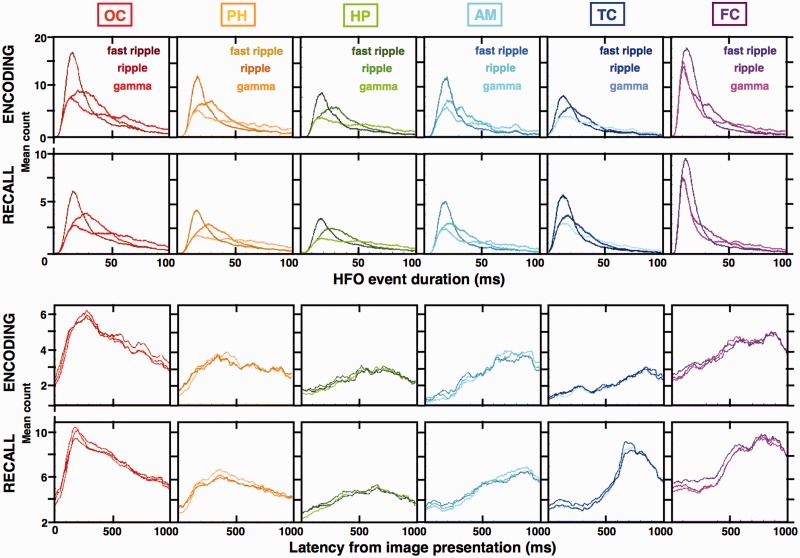
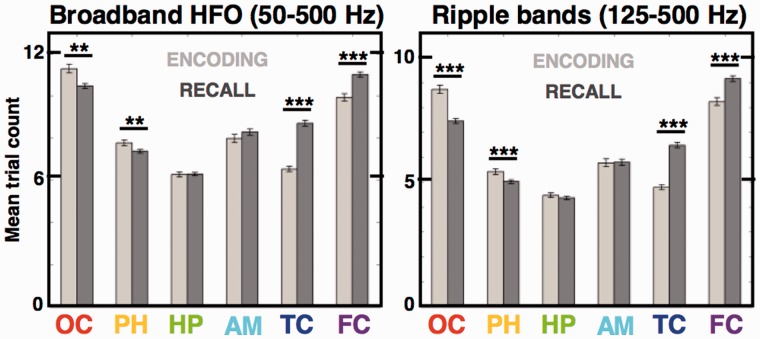
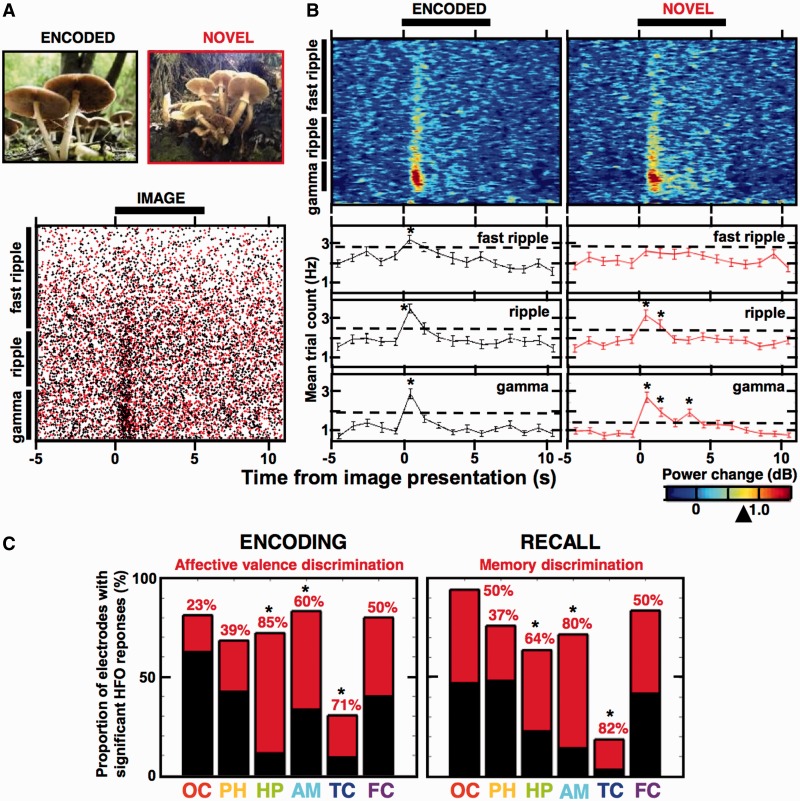
High frequency oscillations are associated with normal brain function, but also increasingly recognized as potential biomarkers of the epileptogenic brain. Their role in human cognition has been predominantly studied in classical gamma frequencies (30-100 Hz), which reflect neuronal network coordination involved in attention, learning and memory. Invasive brain recordings in animals and humans demonstrate that physiological oscillations extend beyond the gamma frequency range, but their function in human cognitive processing has not been fully elucidated. Here we investigate high frequency oscillations spanning the high gamma (50-125 Hz), ripple (125-250 Hz) and fast ripple (250-500 Hz) frequency bands using intracranial recordings from 12 patients (five males and seven females, age 21-63 years) during memory encoding and recall of a series of affectively charged images. Presentation of the images induced high frequency oscillations in all three studied bands within the primary visual, limbic and higher order cortical regions in a sequence consistent with the visual processing stream. These induced oscillations were detected on individual electrodes localized in the amygdala, hippocampus and specific neocortical areas, revealing discrete oscillations of characteristic frequency, duration and latency from image presentation. Memory encoding and recall significantly modulated the number of induced high gamma, ripple and fast ripple detections in the studied structures, which was greater in the primary sensory areas during the encoding (Wilcoxon rank sum test, P = 0.002) and in the higher-order cortical association areas during the recall (Wilcoxon rank sum test, P = 0.001) of memorized images. Furthermore, the induced high gamma, ripple and fast ripple responses discriminated the encoded and the affectively charged images. In summary, our results show that high frequency oscillations, spanning a wide range of frequencies, are associated with memory processing and generated along distributed cortical and limbic brain regions. These findings support an important role for fast network synchronization in human cognition and extend our understanding of normal physiological brain activity during memory processing.

Keywords: cognitive processing; gamma oscillations; high frequency oscillations; memory; neural networks.


Figures

Figure 1
Figure 1
Cognitive processing induces widespread power decrease in low frequency oscillations and focal increases in high frequency bands. The 3D brain views show normalized spectral power changes recorded from temporal cortical surface electrodes (4 × 6 grid) in Patient 8. The power changes are displayed for four frequency bands of oscillations, snapshot at four time-points of trial-averaged image encoding (time 0 corresponds to image presentation). Notice the diffuse loss of low frequency power and emergent multifocal activation in the inferior temporal cortex in all HFO bands, including gamma, ripple and fast ripple frequencies (arrowhead on the power scale points to Jack knifed upper error estimate at P < 0.01 significance level). Note, the power values were interpolated between the electrodes of the grid (spaced 1 cm from each other). See Supplementary Videos 1–4 to view these power changes in real-time of the task trials.
Figure 2
Figure 2
Quantification of cognitively induced HFOs. (A) Sketch of the experimental setup for intracranial patient recordings during the visual recognition memory task. (B) MRI scans show localization of seven bipolar depth-electrode recording sites (reconstructed from a high resolution CT images of the original eight contact points; see Burke et al., 2013) in the right occipital cortex (red), parahippocampal cortex (orange), and the hippocampus (green) from Patient 10. (C, top) Spectrograms of normalized trial-averaged power changes (n = 140 trials; obtained with the multi-taper spectral analysis) were obtained from the seven bipolar recording sites in B (colour-coded) during memory encoding (image presentation time indicated by the horizontal black bar; arrowhead on the power scale points to Jack-knifed upper error estimate at P < 0.01 significance level); (C, middle) cumulative scatterplots show HFO detections from individual trials (140 trials; detected with the Hilbert spectral analysis method—each black dot is one detection – see Fig. 3 and ‘Materials and methods’ section for more details) aligned to the time axis of the spectrograms (notice the close overlap between the activation pattern in trial-averaged power spectrograms and the cumulative HFO scatterplots obtained with the multi-taper and Hilbert transform spectral analyses, respectively); (C, bottom) the HFO detections from the middle panel were summarized as mean trial counts and binned across the same time-axis (dashed line indicates 3 SD above the mean of the five ‘baseline’ bins preceding the image onset). The mean counts from these five baseline bins and the following three bins that overlapped with image presentation (indicated by black significance bar) were used to quantify significant induction of HFO detections (Kruskal-Wallis test, eight time bins, 140 trials, *P < 0.01). Notice that in this example all of the electrodes from the three structures showed significant inductions of HFO discharges, overlapping with the profile of significant induction in the trial-averaged power spectrograms (see Supplementary Fig. 2 for another example of prefrontal cortical electrode response).
Figure 3
Figure 3
Detection of individual HFO discharges using Hilbert transform of filtered z-scored data. (Top) The upper panels show an example 2 s stretch of broadband and filtered data signal (Butterworth bandpass filters, third order) recorded from a prefrontal cortical surface electrode in Patient 7 around the time of image presentation (black vertical lines). Red rectangles correspond to the detections marked in the bottom spectrogram. (Bottom) Power spectrogram (50–500 Hz) of the data epoch from the top panel was obtained by applying Hilbert transform to 1 Hz filtered bands of z-scored signal (Canolty et al., 2006; Matsumoto et al., 2013a, b), calculated from 18 s of the full trial epoch from 6 s before to 12 s after image presentation (note, only 2 s are shown in this figure). Significant HFO power increases were determined at z-score = 3.0 threshold (black arrowhead on the power scale; see ‘Materials and methods’ section) and three representative HFO detections are highlighted by the red rectangles on the spectrogram, as well as on the corresponding filtered data signal above (close up in view in the red rectangle attached from the dashed lines). Notice that the three detections have discrete durations around specific HFO frequencies congruent with the quantification method in Fig. 2 (see Supplementary Fig. 1 for an artefact comparison). See Figs 4 and 5 for the summary of all the detected HFO properties.
Figure 4
Figure 4
Induced HFOs follow the sequence of visual processing stream in the studied cortical and subcortical structures. (A) Diagram shows the model sequence of hypothetical visual processing stream starting in the occipital cortex (OC, red) through the parahippocampal cortex (PH, orange), hippocampus (HP, green), amygdala (AM, cyan), ending on the temporal (TC, blue) and frontal (FC, magenta) cortices. (B–E) These panels summarize the properties of all induced HFOs (from 0–1 s post-stimulus presentation during the encoding stage) detected on the electrodes with significant HFO responses (see Supplementary Table 1 and Fig. 2; n = 8028 occipital, 5294 parahippocampal, 4400 hippocampal, 2213 amygdala, 4186 temporal cortex, 3456 frontal cortex detections). (B) Distributions of the induced HFO latencies from image presentation (Time 0) are presented as histogram counts averaged for all electrodes in the studied structures (colour-coded vertical lines indicate the peak latency in the studied structures). Notice that the sequence of the distribution peaks follows the model processing stream (Wilcoxon rank sum test, P < 0.01). (C) Distributions of the mean HFO durations across the processing stream structures are plotted as in B, with values of durations corresponding to the peak HFO count summarized in the insert diagram. Notice that most HFOs in the hippocampus amygdala and parahippocampal cortex were longer than in the other cortical regions (Wilcoxon rank sum test, P < 0.01). (D, left) Mean HFO frequency distribution across the gamma, ripple and fast ripple bands are plotted as in B and C; (right) mean trial peak values from the frequency distributions are plotted for each frequency band and the gamma-to-fast ripple peak ratio is summarized in the insert diagram. Notice the differences in relative proportions of gamma and fast ripple ratios along the visual stream structures. (E) Mean HFO amplitudes in all structures show uniform, closely overlapping distributions. Plots in the figure were smoothed using a moving sliding average of 10 samples to facilitate data interpretation.
Figure 5
Figure 5
The high gamma, ripple and fast ripple induced HFOs have distinct durations and consistent latencies from image presentation. Distributions of all induced HFO detections from Fig. 4 (from the encoding stage of the task) were broken down into the high gamma, ripple and fast ripple bands and presented together with all the detections from the recall stage [n = 18 095 occipital (OC), 13 755 parahippocampal (PH), 9317 hippocampal (HP), 4965 amygdala (AM), 7706 temporal cortex (TC), 6729 frontal cortex (FC) detections]. (A) Histogram counts of gamma, ripple and fast ripple HFO durations reveal distinct population distributions with significantly different means in every color-coded structure (gamma > ripple > fast ripple, Wilcoxon rank sum test, P < 0.01). The average HFO duration in each band corresponds to ∼4–10 cycles of oscillation. (B) The three HFO bands show overlapping distributions of the mean latency trial counts from image presentation and show the same progression along the visual processing stream as in Fig. 4—the sharp induction of the occipital HFOs early after image presentation, followed by gradual accumulation in subsequent structures of the visual stream with late peaks in the temporal and frontal cortices. Plots in the figure were smoothed using a moving sliding average of 10 samples to facilitate data interpretation. Notice that the durations and latencies were consistent in the encoding and recall stage of the task in all structures except for temporal and frontal cortex, where HFO latencies were significantly longer during memory recall (see Fig. 6 for memory modulation of the HFO counts in the six structures during the two task stages).
Figure 6
Figure 6
Human memory encoding and recall reveals bottom-up and top-down modulation of the induced HFOs. Bar plots compare mean trial counts of all induced HFOs (Fig. 4) during image encoding versus recall across the structures of the model visual processing stream. Memory encoding induced significantly more HFOs per trial in the early ‘sensory’ stream areas contrasted by the ‘association’ areas, which noted significantly more HFOs during memory recall [Wilcoxon rank sum test; **P < 0.01, ***P < 0.001; n = 5450 occipital (OC), 3504 parahippocampal (PH), 2947 hippocampal (HC), 1541 amygdala (AM), 2930 temporal cortex (TC), 2659 frontal cortex (FC) detections in the encoding stage and n = 11 931 occipital, 8784 parahippocampal, 6086 hippocampal, 3334 amygdala, 5545 temporal cortex, 5028 frontal cortex in the recall stage). Notice that this effect was still significant when limited to the 125–500 Hz ripple and fast ripple bands, excluding gamma HFOs (right).
Figure 7
Figure 7
Induced HFOs reveal discriminative responses to the encoded images. (A, top) Examples of two similar pictures (analogous to the International Affective Picture System (IAPS) set of images used in the study, which were not allowed for publication)—one previously seen during encoding (black code) and the other novel (red code); (A, bottom) cumulative scatterplot of all HFO detections in the three frequency bands recorded from an example amygdala electrode in Patient 8 during his memory recall—black dots were detected from trials with encoded images and the red dots from trials with novel images of the same session (black bar indicates the time-course of image presentation). (B, top) Spectrograms summarize trial-averaged power changes (plotted as in Fig. 2) in the two trial types from the scatterplot in A, (B, bottom) the mean trial counts for the scatterplot in A (see Fig. 2) are summarized separately for the gamma, ripple and fast ripple detections, aligned to the trial time-course of the spectrograms. Notice significant induction of the HFOs in individual bins as compared to matched average count from the five ‘baseline’ bins (Wilcoxon signed-rank test, *P < 0.01, encoded: 77 trials; novel: 55 trials), which is not present in the fast ripple response to novel images and was significantly different from the fast ripple response to encoded images (Friedman ANOVA, eight time bins, 55 trials, P = 0.013; see Fig. 2). (C) Proportion of all electrodes that showed discriminative HFO responses (as in B) to affectively charged images during encoding (left) and to the encoded images during recall (right) are summarized across the studied structures (the total black bar indicates number of electrodes with significantly induced HFOs and its red part indicates fraction of these electrodes that showed significant differences; see Supplementary Table 1). Notice that the highest fraction of electrodes with the discriminative HFO responses is reported in the hippocampus, amygdala and the temporal cortex, consistently exceeding 50% (marked with asterisk).

Comment in

References

    1. Axmacher N, Elger CE, Fell J. Ripples in the medial temporal lobe are relevant for human memory consolidation. Brain J Neurol. 2008;131:1806–17. - PubMed
    1. Ball T, Kern M, Mutschler I, Aertsen A, Schulze-Bonhage A. Signal quality of simultaneously recorded invasive and non-invasive EEG. Neuroimage. 2009;46:708–16. - PubMed
    1. Baker SN, Gabriel C, Lemon RN. EEG oscillations at 600 Hz are macroscopic markers for cortical spike bursts. J Physiol. 2003;550:529–34. - PMC - PubMed
    1. Barth DS. Submillisecond synchronization of fast electrical oscillations in neocortex. J Neurosci. 2003;23:2502–10. - PMC - PubMed
    1. Bokil H, Andrews P, Kulkarni JE, Mehta S, Mitra PP. Chronux: a platform for analyzing neural signals. J Neurosci Methods. 2010;192:146–51. - PMC - PubMed

Publication types

MeSH terms