. 2014 Aug;137(Pt 8):2210-30.
doi: 10.1093/brain/awu133. Epub 2014 Jun 11.

On the nature of seizure dynamics

Affiliations

On the nature of seizure dynamics

Viktor K Jirsa et al. Brain. 2014 Aug.

Abstract

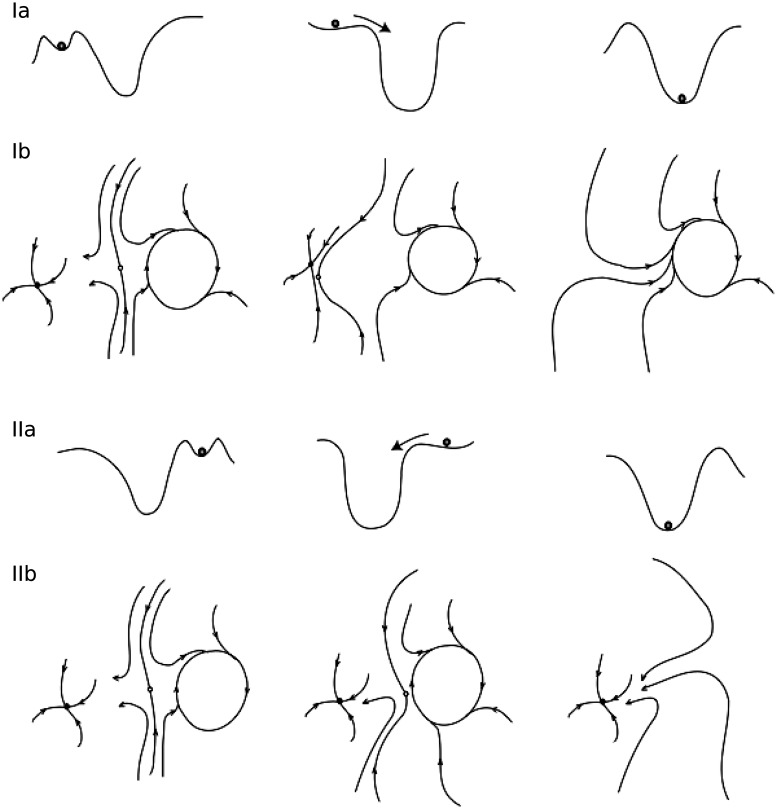
Seizures can occur spontaneously and in a recurrent manner, which defines epilepsy; or they can be induced in a normal brain under a variety of conditions in most neuronal networks and species from flies to humans. Such universality raises the possibility that invariant properties exist that characterize seizures under different physiological and pathological conditions. Here, we analysed seizure dynamics mathematically and established a taxonomy of seizures based on first principles. For the predominant seizure class we developed a generic model called Epileptor. As an experimental model system, we used ictal-like discharges induced in vitro in mouse hippocampi. We show that only five state variables linked by integral-differential equations are sufficient to describe the onset, time course and offset of ictal-like discharges as well as their recurrence. Two state variables are responsible for generating rapid discharges (fast time scale), two for spike and wave events (intermediate time scale) and one for the control of time course, including the alternation between 'normal' and ictal periods (slow time scale). We propose that normal and ictal activities coexist: a separatrix acts as a barrier (or seizure threshold) between these states. Seizure onset is reached upon the collision of normal brain trajectories with the separatrix. We show theoretically and experimentally how a system can be pushed toward seizure under a wide variety of conditions. Within our experimental model, the onset and offset of ictal-like discharges are well-defined mathematical events: a saddle-node and homoclinic bifurcation, respectively. These bifurcations necessitate a baseline shift at onset and a logarithmic scaling of interspike intervals at offset. These predictions were not only confirmed in our in vitro experiments, but also for focal seizures recorded in different syndromes, brain regions and species (humans and zebrafish). Finally, we identified several possible biophysical parameters contributing to the five state variables in our model system. We show that these parameters apply to specific experimental conditions and propose that there exists a wide array of possible biophysical mechanisms for seizure genesis, while preserving central invariant properties. Epileptor and the seizure taxonomy will guide future modeling and translational research by identifying universal rules governing the initiation and termination of seizures and predicting the conditions necessary for those transitions.

Keywords: EEG; bifurcation; epilepsy; modelling; non-linear dynamics.


Figures

Figure 1
Figure 1
Experimental model of spontaneous SLEs. (A) When placed in persistent epileptogenic conditions, SLEs are generated at regular intervals in the isolated mouse whole hippocampus at postnatal Day 6 in vitro. Direct current recordings show a DC shift at SLE onset, which reverses after SLE offset. (B–D) Correspond to insets b–d in A.
Figure 2
Figure 2
Seizure patterns conserved across species and brain regions. All displayed recordings were obtained in alternating current mode, thus filtering very slow variations of the field potential. (A) SLE recorded in mouse whole hippocampus displaying a typical sequence of tonic and tonic-clonic patterns. Two generic patterns can be distinguished: fast discharges (#) and large spike and wave events (*). Note that fast discharges can be embedded in the wave (*#). (B) Hyperthermia-induced SLE recorded in vivo in zebrafish display similar patterns, with fast discharges shown in panel I and SWE in panel II. (C) Spontaneous seizure recorded in an epileptic patient (Supplementary Table 1) displaying a fast discharge followed by the occurrence of spike and wave events. Note that in all three species, there is a slowing down of the activity when reaching seizure offset.
Figure 3
Figure 3
Caricatures of the flows in state space of ensemble 1 as the slow permittivity variable z changes. Rows Ia and IIa indicate metaphorically the bistability of the ‘normal’ (left minimum, Ia) and seizure (right minimum, IIa) state, as well as its loss. Note that ‘normal’ brain trajectories are displayed as a fixed point for the sake of illustration (it does not reflect the diversity of possible trajectories). Rows Ib and IIb show the corresponding flows in state space. As the permittivity z decreases (from left to right), rows Ia and Ib show how the interictal state loses its stability and the transition occurs towards the ictal state (seizure onset) via a saddle-node bifurcation. Rows IIa and IIb show the equivalent situation for increasing values of z and the homoclinic bifurcation leading to seizure offset.
Figure 4
Figure 4
Bifurcation diagram of the Epileptor. (A) The set of fixed points form curves, where the solid line indicates the stable fixed point. A branch of limit cycles terminates at the homoclinic bifurcation point (HB), whereas the fixed points lose stability via saddle-node bifurcations (SN). The system displays bistability between the left saddle-node bifurcation point (SN) and the homoclinic bifurcation point (HB). (B) The projection of the Epileptor trajectory is plotted onto the bifurcation diagram.
Figure 5
Figure 5
Slow permittivity state variable and seizure topology. (A, left) Seizure generated by the Epileptor with five state variables. Seizure onset, time course and offset are controlled by the permittivity state variable evolving slowly in time (red). Note that the SLE occurs with a rapid and large shift of the potential. Right, the seizure trajectory (expressed in terms of −x1 + x2) is approximated in a 3D space defined by the first state variables (X = −x1 and Y = x2) and by the slow permittivity variable (Z = z). Note that the values of the z-variable have been shifted upwards for plotting purposes. (B, left), simultaneous recording in the hippocampus of a SLE in low Mg2+ conditions in DC mode, O2 levels in the preparation (yellow) and NADH levels (red), which indirectly reflect ATP use. Note the large DC shift during the SLE, as predicted by Epileptor. The time course of oxygen and NADH is similar to that of the slow permittivity variable. Right, the 3D representation of a seizure in a delayed space (X and Y), with Z the extracellular potassium concentration measured simultaneously (Supplementary Fig. 8) is very similar to that obtained by the Epileptor in A.
Figure 6
Figure 6
Homoclinic bifurcation at seizure offset in various species. (A) In a mouse hippocampus, interspike intervals display logarithmic scaling typical of a homoclinic bifurcation. The last spike of the seizure is used as our reference time point (red squares mark seizure durations). After accounting for uncertainty in seizure onset time and clonic firing at seizure termination, log scaling fit the data better than other potential models (Supplementary Fig. 9A). The interspike interval from this reference displays a logarithmic scaling, which characterizes a homoclinic bifurcation in the three species. Red line: a log equation fit to the last seven datapoints (t < 10) and extrapolated. (B) Summary of all measures performed in mice hippocampi (n = 16), zebrafish (n = 2) and human (n = 24). Logarithmic scaling is preserved in all species. Note the similarity between the different human subjects, who had a wide array of epilepsy pathologies (Supplementary Table 1). The slope difference relates to differences in seizure duration in the various conditions. (C) Logarithmic scaling in zebrafish. (D) In human, we show independent seizures simultaneously recorded in the right and left hemisphere with different dynamics, both showing log scaling. Inset: corrected equation fit (red) ignores fast spiking between clonic bursts in the last 30 s of seizure. LSS = Left somatosensory cortex; RIT = Right inferior temporal lobe.
Figure 7
Figure 7
Different paths to seizure onset. (A) Stimulations (red stars, traces b, c, d and e) given to Epileptor between two SLEs (trace a shows Epileptor regular behaviour) either failed to trigger a SLE (traces b and c) or generated one before expected (traces d and e). This predicts the presence of a refractory period occurring right after SLE offset and that the system can be pushed toward SLE onset. (B) Experimental verification. Top: The whole hippocampus and the septum connected to each other were placed in two different chambers (inset). After generating a series of SLEs in the hippocampus in low Mg2+ conditions, the extracellular concentration of Mg2+ was raised to 0.4 mM, which maintained the hippocampus below the SLE threshold. The septum was bathed with normal artificial CSF. Bottom: A stimulating electrode was placed in the septum to stimulate axons projecting to the hippocampus. The stimulation generated a small DC shift followed by a SLE. The same train applied after seizure offset failed to evoke a SLE. After waiting >10 min, stimuli of equal magnitude produced a SLE (not shown). (C) Top: noise was progressively increased in Epileptor until seizure onset was reached leading to the prediction that synaptic noise is sufficient to drive the system to the bifurcation. Note that the number of spikes before seizure onset scales with the distance to the bifurcation. (D) Experimental validation. The hippocampus (H) was placed in subthreshold conditions as in B. Top: a hippocampal neuron was recorded in voltage clamp mode at +10 mV to measure GABAergic currents. The extracellular concentration of K+ was raised by 5 mM in the septum (S), leading to increased cell firing there, which correlated with an increase in synaptic activity received by the neuron. This led to the occurrence of a SLE. The septum was then returned to normal artificial CSF conditions. Changing osmolarity in the hippocampus with 50 mM mannitol was sufficient to induce a SLE without increasing synaptic noise (Supplementary Table 2). Bottom: Both procedures were synergistic. Raising [K+] by 2 mM in the septum or adding 10 mM mannitol were not sufficient to trigger a SLE by themselves. When they were both combined, a SLE could be evoked, demonstrating that multiple different trajectories can lead to seizure onset. aCSF = artificial CSF; LFP = local field potential; stim = stimulation; TU = arbitrary time units; VC = voltage clamp.
Figure 8
Figure 8
Possible physiological correlates of ensembles 1 and 2 of Epileptor. Cell attached recording A and whole cell current clamp recording B of two stratum oriens interneurons in the CA1 region during a SLE. (A) The GABA neuron fired at SLE onset during the large spike and wave (1), stopped during the fast oscillation (2) and resumed firing when spike and wave reappeared (3). Note that during the late spike and wave event (3), the GABA neuron stops firing during the wave when the fast oscillation occurs. (B) The current clamp recording shows that the cell stops firing as it enters into depolarization block. (C) Whole cell recording in voltage clamp mode of GABAergic currents. Note the presence of large GABAergic inputs during the large spike and wave before SLE onset (1), their loss during the fast oscillation (2), and their re-occurrence during the late part of the SLE (3). Note that GABAergic currents are absent during the fast oscillation of the late spike and wave complex (3). (D) Whole cell voltage clamp recording of synaptic glutamatergic currents received by a GABA neuron during a SLE. Note that the cell receives strong glutamatergic inputs during all phases of the SLE, including spikes (1 and 3) and fast oscillations (2). Note the remarkable synchrony between the glutamatergic currents and the field during the fast oscillation (2).

Comment in

References

    1. Andrew RD. Seizure and acute osmotic change: clinical and neurophysiological aspects. J Neurol Sci. 1991;101:7–18. - PubMed
    1. Arya R, Kabra M, Gulati S. Epilepsy in children with down syndrome. Epileptic Disord. 2011;13:1–7. - PubMed
    1. Bak P, Paczuski M. Complexity, contingency, and criticality. Proc Natl Acad Sci USA. 1995;92:6689–96. - PMC - PubMed
    1. Bartolomei F, Chauvel P, Wendling F. Epileptogenicity of brain structures in human temporal lobe epilepsy: a quantified study from intracerebral EEG. Brain. 2008;131(Pt 7):1818–30. - PubMed
    1. Bazhenov M, Timofeev I, Frohlich F, Sejnowski TJ. Cellular and network mechanisms of electrographic seizures. Drug Discov Today Dis Models. 2008;5:45–57. - PMC - PubMed

Publication types