. 2014 Jun 11;34(24):8072-82.
doi: 10.1523/JNEUROSCI.0200-14.2014.

Deficits in predictive coding underlie hallucinations in schizophrenia

Affiliations

Deficits in predictive coding underlie hallucinations in schizophrenia

Guillermo Horga et al. J Neurosci. .

Abstract

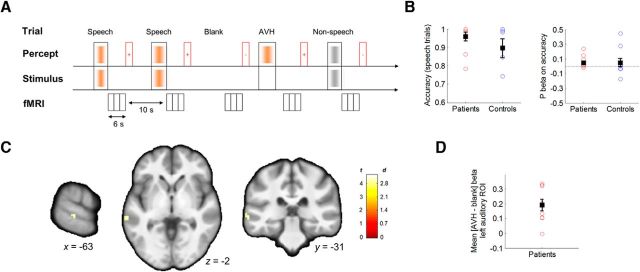
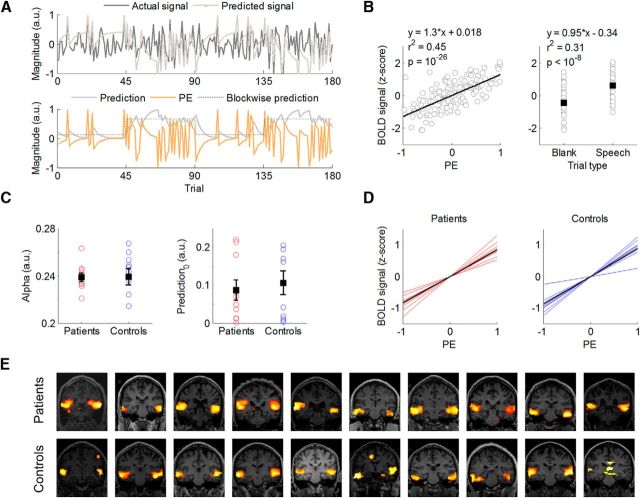
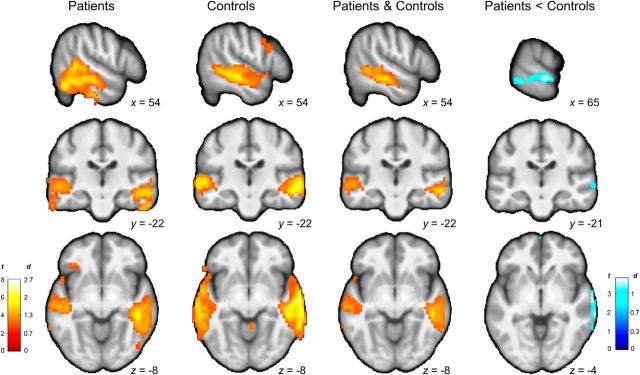
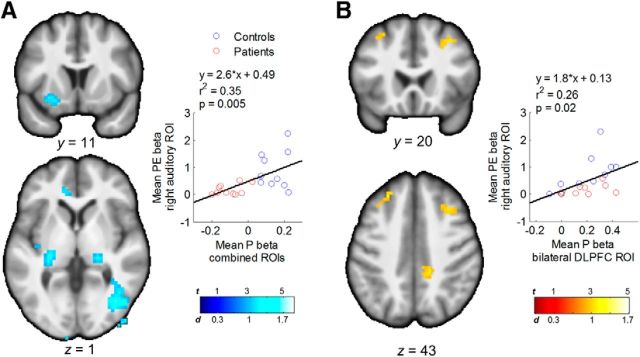
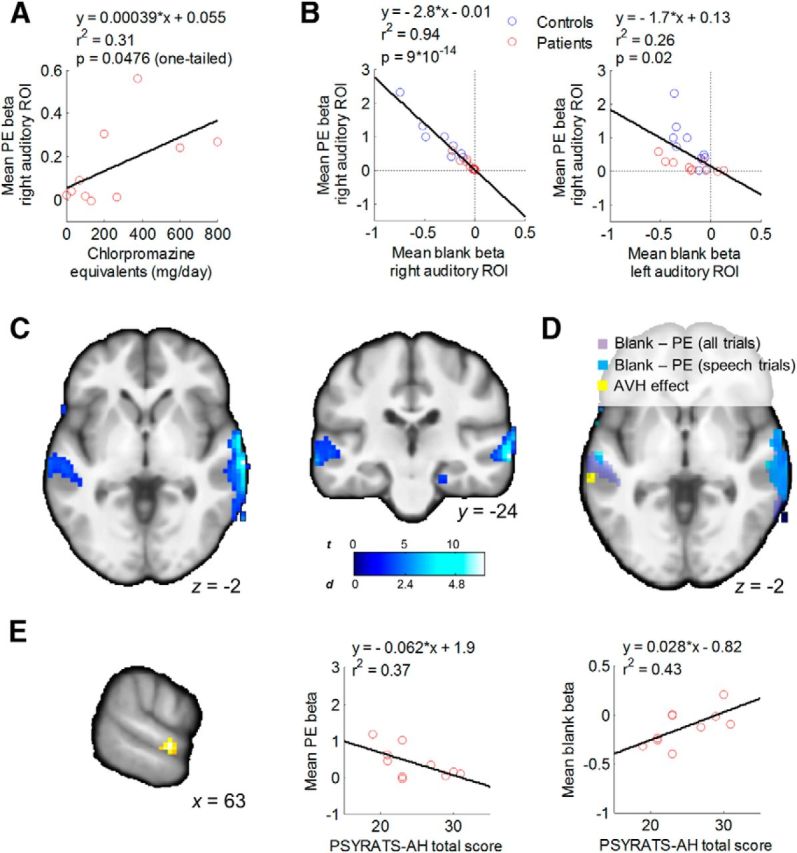
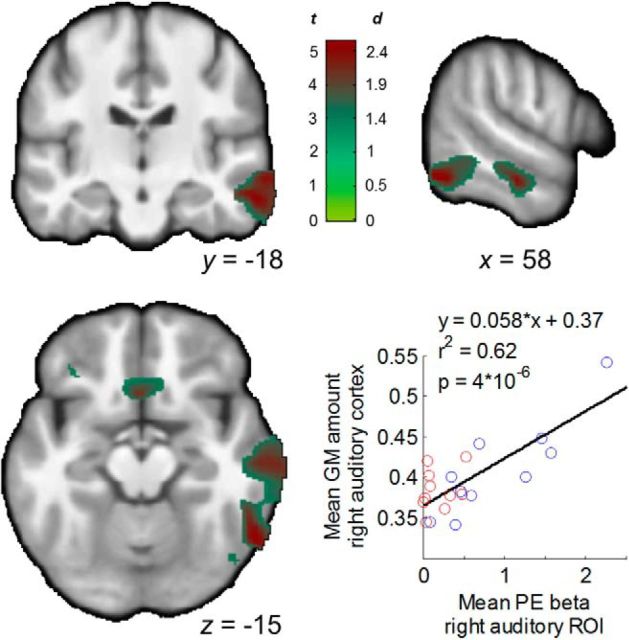
The neural mechanisms that produce hallucinations and other psychotic symptoms remain unclear. Previous research suggests that deficits in predictive signals for learning, such as prediction error signals, may underlie psychotic symptoms, but the mechanism by which such deficits produce psychotic symptoms remains to be established. We used model-based fMRI to study sensory prediction errors in human patients with schizophrenia who report daily auditory verbal hallucinations (AVHs) and sociodemographically matched healthy control subjects. We manipulated participants' expectations for hearing speech at different periods within a speech decision-making task. Patients activated a voice-sensitive region of the auditory cortex while they experienced AVHs in the scanner and displayed a concomitant deficit in prediction error signals in a similar portion of auditory cortex. This prediction error deficit correlated strongly with increased activity during silence and with reduced volumes of the auditory cortex, two established neural phenotypes of AVHs. Furthermore, patients with more severe AVHs had more deficient prediction error signals and greater activity during silence within the region of auditory cortex where groups differed, regardless of the severity of psychotic symptoms other than AVHs. Our findings suggest that deficient predictive coding accounts for the resting hyperactivity in sensory cortex that leads to hallucinations.


Figures

Figure 1.
Figure 1.
Schematic of the speech decision-making task and yoked sparse-sampling fMRI sequence. A, Trial types (speech, non-speech, blank, and AVH; top) are defined based on the external stimuli and the subjective percepts reported by participants after each volume acquisition cluster (bottom). The timeline indicates presentation of stimuli before image acquisition. Following image acquisition, participants are asked to indicate whether they heard voices or not on that trial (red rectangles indicate question periods; +/− signs indicate responses). B, The scatterplots show a lack of significant group differences in discrimination accuracy on speech trials (left) and in prediction effects on accuracy (right). Whisker plots indicate group mean and SEM. C, Contrast maps (t statistic and effect size in Cohen's d) depict increased activation in the left auditory cortex during AVH trials compared with blank trials in the nine patients who reported hallucinations in the scanner (peak MNI coordinates: −63, −31, −2 mm; Brodmann area 22). D, Scatterplot of individual contrast estimates in the left auditory region from the voxelwise analysis.
Figure 2.
Figure 2.
Model-based analysis of individual fROI signals. A, Model-fitting and model-derived time series of Ps and PEs for a representative individual. By minimizing differences between the actual and predicted signal (top), our algorithm provides trial-by-trial estimates of P and PE (bottom). Note the approximate correspondence between the blockwise P manipulated by the task and the model-based P estimate. B, BOLD signal from an fROI in the auditory cortex of a representative individual is plotted as a function of PEs (left) and as a function of trial type (right). C, Individual best-fitting parameters by group. Nonzero speech predictions at the beginning of the task (P0, t(19) = 4.78, p = 10−5) reflect that participants in both groups (t(18)= −0.46, p = 0.65, two-sample t test) expected to hear speech, accordingly with task instructions. D, Individual PE effects by group in fROI-based analyses. E, Voxelwise regression of PE time series shows PE signals in auditory cortex for each participant (overlaid on a coronal view of individual T1-weighted images).
Figure 3.
Figure 3.
Voxelwise analyses of PE signals. From left to right, Regions of the auditory cortex in which activity tracks PEs in patients, control subjects, and both. Patients show weaker PE signals in the right auditory cortex (peak MNI coordinates: 69, −31, −8 mm; Brodmann areas 21–22). Color maps represent t statistic and effect size in Cohen's d.
Figure 4.
Figure 4.
Differential and common effects of prediction signals between groups. A, Regions with weaker P signals in patients relative to control subjects (all p < 0.037, corrected). The scatterplot shows a positive correlation between pooled prediction signals from the latter analysis and PE signals in the right auditory ROI (from the significant cluster of group differences shown in Fig. 3). B, Common prediction signals in bilateral portions of the DLPFC across groups, and correlation between prediction signals in this region and PE signals in the right auditory cortex.
Figure 5.
Figure 5.
Deficient PEs account for individual differences in activity of the auditory cortex during silence. A, Correlation between PE deficit in patients and dose of antipsychotic medication. B, Correlations between the PE deficit in the right auditory cortex and activity during blank trials in the same region (left), and a contralateral region showing increased activation during AVH in patients (right; Fig. 1C). These effects remained after controlling for group (r2 = 0.92, p = 10−12, and r2 = 0.33, p = 0.009, respectively, in the right and left auditory cortex). C, D, Voxelwise regression analyses that localize the effect of the PE deficit on blank trial activity to the auditory cortex bilaterally but not to other regions. E, Conjunction of correlations between AVH severity and both PE magnitude and activity during blank trials in the right auditory cortex within patients. Scatterplots indicating the direction of the pairwise relationships between the corresponding β values from the cluster (left) and AVH severity are shown (middle and right).
Figure 6.
Figure 6.
Structure–function correlation. Maps show a correlation between gray matter volume in the right auditory cortex and the functional deficit in PEs in a similar region of the auditory cortex (significant cluster in the group comparison from Fig. 3). The scatterplot shows this relationship across participants using averaged data from the significant cluster in the VBM analysis. This relationship remained (r2 = 0.36, p = 0.007) after removing an outlier point corresponding to the VBM measure for one healthy participant (Cook's distance = 1.63).

References

    1. Akaike H. New look at statistical-model identification. IEEE Trans Automat Contr. 1974;19:716–723. doi: 10.1109/TAC.1974.1100705. - DOI
    1. Belin P, Zatorre RJ, Lafaille P, Ahad P, Pike B. Voice-selective areas in human auditory cortex. Nature. 2000;403:309–312. doi: 10.1038/35002078. - DOI - PubMed
    1. Chumbley JR, Friston KJ. False discovery rate revisited: FDR and topological inference using Gaussian random fields. Neuroimage. 2009;44:62–70. doi: 10.1016/j.neuroimage.2008.05.021. - DOI - PubMed
    1. Cleghorn JM, Garnett ES, Nahmias C, Brown GM, Kaplan RD, Szechtman H, Szechtman B, Franco S, Dermer SW, Cook P. Regional brain metabolism during auditory hallucinations in chronic schizophrenia. Br J Psychiatry. 1990;157:562–570. doi: 10.1192/bjp.157.4.562. - DOI - PubMed
    1. Cook RD. Influential observations in linear-regression. J Am Stat Assoc. 1979;74:169–174. doi: 10.1080/01621459.1979.10481634. - DOI

Publication types

MeSH terms