. 2014 Jun 11;34(24):8130-8.
doi: 10.1523/JNEUROSCI.4399-13.2014.

Parallel midbrain microcircuits perform independent temporal transformations

Affiliations

Parallel midbrain microcircuits perform independent temporal transformations

C Alex Goddard et al. J Neurosci. .

Abstract

The capacity to select the most important information and suppress distracting information is crucial for survival. The midbrain contains a network critical for the selection of the strongest stimulus for gaze and attention. In avians, the optic tectum (OT; called the superior colliculus in mammals) and the GABAergic nucleus isthmi pars magnocellularis (Imc) cooperate in the selection process. In the chicken, OT layer 10, located in intermediate layers, responds to afferent input with gamma periodicity (25-75 Hz), measured at the level of individual neurons and the local field potential. In contrast, Imc neurons, which receive excitatory input from layer 10 neurons, respond with tonic, unusually high discharge rates (>150 spikes/s). In this study, we reveal the source of this high-rate inhibitory activity: layer 10 neurons that project to the Imc possess specialized biophysical properties that enable them to transform afferent drive into high firing rates (~130 spikes/s), whereas neighboring layer 10 neurons, which project elsewhere, transform afferent drive into lower-frequency, periodic discharge patterns. Thus, the intermediate layers of the OT contain parallel, intercalated microcircuits that generate different temporal patterns of activity linked to the functions of their respective downstream targets.

Keywords: attention; colliculus; decision; inhibition; tectum.


Figures

Figure 1.
Figure 1.
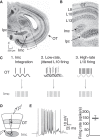
Connectivity and activity of the midbrain selection network in vitro. A, Transverse Nissl-stained section through the midbrain selection network. The OT makes reciprocal connections with the Imc and Ipc. Box magnified in B. B, Higher-power view of boxed region in A. Neurons in L10 send excitatory projections to both the Imc and Ipc. C, Three hypotheses to explain high rates of spiking activity in the Imc. Left, The intrinsic properties of Imc neurons permit the integration of the inputs from slower L10 neurons (25–75 spikes/s) to generate high-rate firing output. Middle, Multiple L10 neurons that project to the Imc fire at slow rates but are temporally jittered relative to each other. These jittered inputs yield high input rates onto Imc neurons and thus a high-rate firing output. Right, L10 neurons that project to the Imc fire at high rates, yielding high input rates onto Imc neurons and thus a high-rate firing output. D, Schematic of connectivity and experimental setup. Retinal afferents were electrically stimulated (electrode), driving activity in L10 neurons, which in turn drive Imc neurons. Activity was assayed with patch-clamp recordings. E, Recordings of Imc activity. Left, An example trace of an Imc neuron firing after retinal afferent microstimulation. Right, Summary plot of evoked Imc neuron firing rates. Thick bar represents the median firing rate, and whiskers represent the 25 and 75% percentiles. Median firing rate (followed by 25th and 75th percentiles): 142 spikes/s (126 and 159 spikes/s); n = 19. d, Dorsal; l, lateral.
Figure 2.
Figure 2.
Membrane properties of Imc neurons. Bar plot conventions as in Figure 1E. A, Example of an Imc neuron recorded in current clamp firing at high rates in response to large current injections. Bottom gray lines indicate current injection. B, Plots of firing rate as a function of injected current in 8 Imc neurons. Neurons had varying rheobases and firing rate profiles in response to current injection. Across the population, peak rate was high. Solid and dotted lines are presented for visual clarity and have no meaning. C, Summary plot of Imc neuron membrane time constants. Median τ (25th and 75th percentiles): 13.5 ms (8.5 and 16.0 ms); n = 11. D, Plots of subthreshold membrane potential as a function of injected current. Imc neurons show a clear reduction of I–V slope (rectification) with depolarizing current injections (n = 8).
Figure 3.
Figure 3.
Synaptic properties of Imc neurons. A, Averaged sEPSC from one Imc neuron showing rapid decay. B, Left, Summary plot of sEPSC half-width in Imc neurons. Median half-width (25th and 75th percentiles): 1.3 ms (1.2 and 1.7 ms); n = 15 neurons. Right, Summary plot of sEPSC amplitude in Imc neurons. Median amplitude (25th and 75th percentiles): 90.9 pA (73.1 and 130.3 pA); n = 15 neurons. C, Top, Extracellular spiking of an Imc neuron after retinal afferent stimulation in the OT. Bottom, High-frequency EPSC barrage subsequently recorded in the same neuron in voltage clamp (at −55 mV). Gray arrow indicates time of retinal afferent microstimulation. D, Plot of spike rate versus EPSC rate for Imc neurons. Median spike rate (25th and 75th percentiles): 133 spikes/s (125.5 and 152.8 spikes/s); EPSC rate: 126 PSC/s (115.5 and 150.2 PSC/s); n = 10. Gray circle represents the neuron shown in A. E, Normalized point-process multitaper spectrum of detected PSC event times. Black line indicates mean spectrum, and gray shading indicates SD. n = 12 neurons.
Figure 4.
Figure 4.
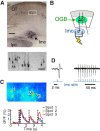
AIM. A, Top, Midbrain network after a biocytin injection placed in the Imc in an in vitro slice. Box indicates region shown in the bottom image. Scale bar, 250 μm. Bottom, Higher-power image of L10, showing retrogradely labeled neurons. Scale bar, 50 μm. B, Schematic of AIM experimental setup. OGB-1 was pressure injected into L10 in vitro. A bipolar electrode was placed across the Imc. The blue neuron represents an antidromically activated neuron, and the red neuron is not antidromically activated. C, Top, Image at 63× of L10 showing the integrated ΔF/F OGB-1 signal after Imc stimulation. Red represents a large increase in fluorescence. Bottom, Time course of ΔF/F signal in three neurons indicated in the top image. Black, Dotted lines indicate times of antidromic stimulus trains. This image is not from the same tissue as shown in A. D, Left, A short-latency, extracellularly recorded L10 action potential (black) after a 0.1 ms electrical pulse (blue) delivered to the Imc. Right, A train of electrical stimuli delivered to the Imc at 100 spikes/s (bottom trace, blue) elicits a consistent, stimulus-locked train of L10 action potentials (top trace, black).
Figure 5.
Figure 5.
AIM uncovers high firing rate neurons in L10 that project to the Imc with distinctive physiological properties. Bar plot conventions as in Figure 1E. A, Schematic of experimental setup. Same as in Figure 4B but with stimulating electrode placed at the retinal afferent layer. B, An antidromically (ant.) activated, putative Imc-projecting L10 neuron (blue; same as in Fig. 3D) fires at a higher rate than a non-antidromically (non-ant.) activated neuron (red) in response to 0.1 ms retinal afferent stimulation (gray arrow). C, Summary plot. In response to retinal afferent stimulation, antidromically activated L10 neurons (blue) responded with a high median (25th and 75th percentiles) spike rate: 133 spikes/s (90.5 and 203 spikes/s); n = 9. In contrast, non-antidromically activated neurons (red) responded with a lower spike rate: 48 spikes/s (37.1 and 75.9 spikes/s); n = 17; p < 0.01. D, In response to identical step current injections (gray line), firing rate in an antidromically activated neuron (blue) is higher than in a non-antidromically activated neuron (red). Same neurons as shown in Figure 5B. E, Plot of firing rate versus current injected for the two neurons shown in D. Antidromically activated neurons (blue) fire at higher rates than non-antidromically activated (red) across various magnitudes of current injection. Gray line represents current injection magnitude shown in D. F, Summary plot of firing rates: antidromically activated L10 neurons (blue) show higher initial (left) and maximal (right) firing rates than non-antidromically activated neurons (red). Median initial rate in antidromically activated neurons: 84.6 spikes/s (20.9 and 147.0 spikes/s), n = 14; non-antidromically activated: 13.2 spikes/s (8.4 and 31.4 spikes/s); n = 33; p < 0.009. Median maximal firing rate (25th and 75th percentiles) in antidromically activated neurons: 201.4 spikes/s (175.5 and 256.4 spikes/s), n = 14; non-antidromically activated: 110.6 spikes/s (77.3 and 182.7 spikes/s), n = 33; p < 0.001, Wilcoxon's rank-sum test. G, Neurons shown in Figure 6B at expanded timescale in response to an ∼50 pA injection. H, Summary plot of rheobase: antidromically activated L10 neurons (blue) require a higher current magnitude to reach threshold than non-antidromically activated neurons (red). Median rheobase in antidromically activated neurons: 175 pA (76 and 277 pA), n = 14; non-antidromically activated: 40 pA (20 and 76 pA), n = 33; p < 0.002, Wilcoxon's rank-sum test. I, Summary plot of spike half-width: antidromically activated L10 neurons (blue) have narrower spike half-widths than non-antidromically activated neurons (red). Median spike half-width in antidromically activated neurons: 0.5 ms (0.4 and 0.6 ms), n = 14; non-antidromically activated: 0.9 ms (0.6 and 1.2 ms), n = 33; p < 0.002, Wilcoxon's rank-sum test. J, Summary plot of AHP duration: antidromically activated L10 neurons (blue) have shorter AHPs than non-antidromically activated neurons (red). Median AHP duration in antidromically activated neurons: 1.2 ms (0.9 and 1.6 ms), n = 14; non-antidromically activated: 2.8 ms (1.5 and 6.4 ms), n = 33; p < 0.002, Wilcoxon's rank-sum test. K, Summary plot of membrane resistance: antidromically activated L10 neurons (blue) have lower: 139 MΩ (93.5 and 229.3 MΩ), n = 14; non-antidromically activated: 591.3 MΩ (311.7 and 1003.4 MΩ), n = 33; p < 0.001, Wilcoxon's rank-sum test.
Figure 6.
Figure 6.
Summary schematic of parallel microcircuits in the OT. Several subtypes of L10 neurons in the OT, shown in different colors, form parallel microcircuits that tile space. For each location in space (purple shading), a set of microcircuits receives topographic input and projects to different downstream targets. Left, One OT microcircuit transforms afferent input into high firing rate output. This output goes to the Imc, which broadcasts high rates of inhibition across the OT and Ipc space maps. Right, Another OT microcircuit transforms afferent input into periodic, lower firing rate output. This output goes to the Ipc, which delivers periodic bursts of activity focally to one place in the OT space map (Goddard et al., 2012).

Similar articles

Cited by

References

    1. Angelo K, Rancz EA, Pimentel D, Hundahl C, Hannibal J, Fleischmann A, Pichler B, Margrie TW. A biophysical signature of network affiliation and sensory processing in mitral cells. Nature. 2012;488:375–378. doi: 10.1038/nature11291. - DOI - PMC - PubMed
    1. Armstrong KM, Fitzgerald JK, Moore T. Changes in visual receptive fields with microstimulation of frontal cortex. Neuron. 2006;50:791–798. doi: 10.1016/j.neuron.2006.05.010. - DOI - PubMed
    1. Brown SP, Hestrin S. Intracortical circuits of pyramidal neurons reflect their long-range axonal targets. Nature. 2009;457:1133–1136. doi: 10.1038/nature07658. - DOI - PMC - PubMed
    1. Crick F. Function of the thalamic reticular complex: the searchlight hypothesis. Proc Natl Acad Sci U S A. 1984;81:4586–4590. doi: 10.1073/pnas.81.14.4586. - DOI - PMC - PubMed
    1. Dutar P, Vu HM, Perkel DJ. Multiple cell types distinguished by physiological, pharmacological, and anatomic properties in nucleus HVc of the adult zebra finch. J Neurophysiol. 1998;80:1828–1838. - PubMed

Publication types

MeSH terms

LinkOut - more resources