. 2014 Jun 11;6(240):240ra74.
doi: 10.1126/scitranslmed.3008008.

Identification of a new modulator of the intercalated disc in a zebrafish model of arrhythmogenic cardiomyopathy

Affiliations

Identification of a new modulator of the intercalated disc in a zebrafish model of arrhythmogenic cardiomyopathy

Angeliki Asimaki et al. Sci Transl Med. .

Erratum in

  • Sci Transl Med. 2014 Nov 5;6(261):261er6

Abstract

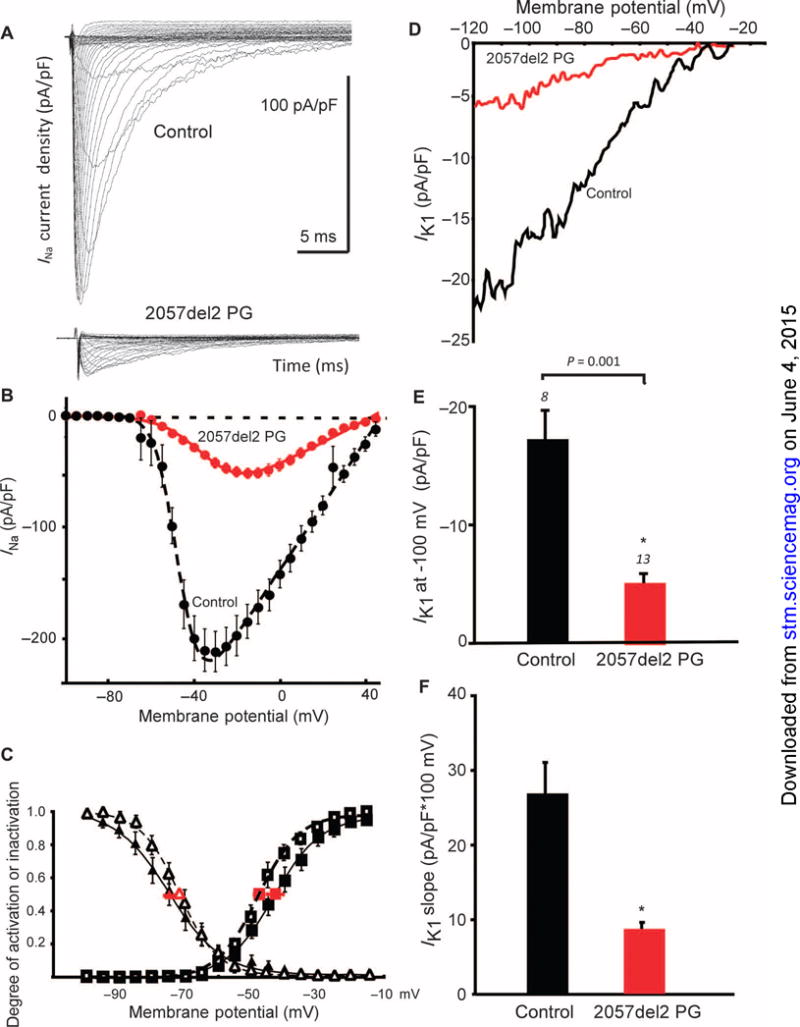
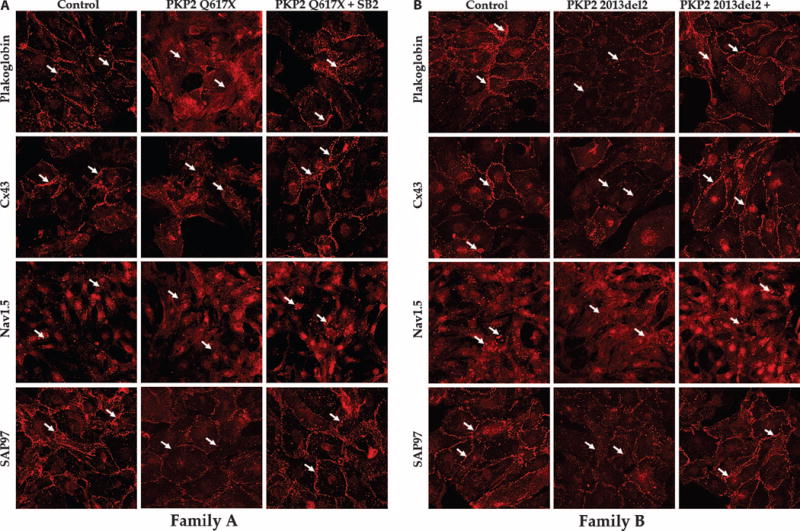
Arrhythmogenic cardiomyopathy (ACM) is characterized by frequent cardiac arrhythmias. To elucidate the underlying mechanisms and discover potential chemical modifiers, we created a zebrafish model of ACM with cardiac myocyte-specific expression of the human 2057del2 mutation in the gene encoding plakoglobin. A high-throughput screen identified SB216763 as a suppressor of the disease phenotype. Early SB216763 therapy prevented heart failure and reduced mortality in the fish model. Zebrafish ventricular myocytes that expressed 2057del2 plakoglobin exhibited 70 to 80% reductions in I(Na) and I(K1) current densities, which were normalized by SB216763. Neonatal rat ventricular myocytes that expressed 2057del2 plakoglobin recapitulated pathobiological features seen in patients with ACM, all of which were reversed or prevented by SB216763. The reverse remodeling observed with SB216763 involved marked subcellular redistribution of plakoglobin, connexin 43, and Nav1.5, but without changes in their total cellular content, implicating a defect in protein trafficking to intercalated discs. In further support of this mechanism, we observed SB216763-reversible, abnormal subcellular distribution of SAP97 (a protein known to mediate forward trafficking of Nav1.5 and Kir2.1) in rat cardiac myocytes expressing 2057del2 plakoglobin and in cardiac myocytes derived from induced pluripotent stem cells from two ACM probands with plakophilin-2 mutations. These observations pinpoint aberrant trafficking of intercalated disc proteins as a central mechanism in ACM myocyte injury and electrical abnormalities.


Figures

Fig. 1
Fig. 1. Zebrafish model of ACM and chemical screen
(A and B) Representative images of a 5-week-old control sibling (A) and 2057del2 plakoglobin (PG) zebrafish (B) (scale bars, 1 mm), dissected hearts [control sibling (A′) and 2057del2 plakoglobin (B′); scale bars, 200 μm; OFT, outflow tract; a, atrium; v, ventricle], and hematoxylin and eosin–stained sections [control sibling (A″) and 2057del2 plakoglobin mutant fish (B″); scale bars, 200 μm] showing cardiomegaly, wall thinning, and chamber dilatation in early adulthood. (C) Survival curves for control and 2057del2 plakoglobin mutant fish. Data were pooled from three independent experiments and presented as total percentage fish survival as a function of time (n = 125; P < 0.0001, Mantel-Cox test). WT, wild type. (D) Ventricle/body size ratios in control sibling versus 2057del2 plakoglobin mutants at 5 weeks of age. (E to G) Heart rate [beats per minute (Bpm); n = 50; P < 0.05, unpaired t test] (E), stroke volume [diastolic volume minus systolic volume (nl); n = 8; P < 0.05, unpaired t tests] (F), and cardiac output [stroke volume × heart rate (nl/min)] (G) in control sibling versus 2057del2 plakoglobin fish measured in 48-hour post-fertilization larvae (n = 12; P < 0.05, unpaired t test). (H) Quantitative reverse transcription polymerase chain reaction (qRT-PCR) showing twofold induction of the cardiac natriuretic peptide BNP in Naxos embryos compared to control siblings at 72 hours after fertilization (n = 3; *P < 0.01, unpaired t tests). (I) Luciferase-based reporter for cardiac natriuretic peptide expression in control siblings (BNP-LUC) and 2057del2 plakoglobin (BNP-LUC 2057del2 PG) embryos at 72 hours after fertilization (n = 30; *P < 0.01, unpaired t tests). (J) BNP luciferase activity of BNP-LUC 2057del2 PG embryos (72 hours after fertilization) after dimethyl sulfoxide (DMSO) and SB216763 (SB2) treatment (n = 36; *P < 0.001, unpaired t test). (K) Percent survival of untreated 2057del2 plakoglobin fish and 2057del2 plakoglobin fish treated with SB216763. SB216763 was added to the water at 24 hours after fertilization and washed out at 6 days. Fish were put on regular flow for an additional 4 weeks, and survival was counted. Data were pooled from three independent experiments (n = 300; *P < 0.01, unpaired t test).
Fig. 2
Fig. 2. Cellular electrophysiology in zebrafish ventricular myocytes
(A) Representative action potential tracings from a zebrafish ventricular myocyte that expressed 2057del2 plakoglobin (red) or a control fish myocyte (black) measured at 5 weeks after fertilization. (B) Action potential upstrokes and first-time derivatives (dV/dt) in zebrafish myocytes that expressed 2057del2 plakoglobin (red) versus control myocytes (black) at enlarged time scale. (C) Representative action potential tracings in a neonatal rat ventricular myocyte that expressed 2057del2 plakoglobin (red) versus a control myocyte (black) showing a positive shift in resting potential, and action potential prolongation. Action potential dV/dtmax decreased from 75 ± 20 V/s in control neonatal rat ventricular myocytes to 6 to 32 ± 7 V/s in myocytes that expressed 2057del2 plakoglobin (n = 12 for each; P < 0.01, unpaired t test). Note virtually identical changes to those seen in zebrafish myocyte action potentials.
Fig. 3
Fig. 3. Decreased INa and IK1 current density in mutant zebrafish myocytes
(A to C) Changes in INa current density in zebrafish myocytes that expressed 2057del2 plakoglobin. (A) Original traces. (B) Dependence of INa on membrane potential (red, 2057del2 plakoglobin; black, control). (C) Steady-state activation (squares) and inactivation (triangles) curves (closed symbols, 2057del2 plakoglobin; open symbols, controls). The Boltzmann fit to individual experiments used to calculate the V0.5 values for steady-state activation and inactivation (mean ± SEM; red symbols) showed no significant effect of 2057del2 plakoglobin expression. (D to F) Changes in IK1 current density in zebrafish myocytes that expressed 2057del2 plakoglobin. (D) Original traces obtained after subtraction of the Ba2+-insensitive component. (E) IK1 current at −100 mV. (F) IK1 slope of linear portion between −100 and −60 mV. Numbers above bars in graphs indicate n for each condition. *P < 0.001 versus control, unpaired t test.
Fig. 4
Fig. 4. Reversal of electrophysiological defects in mutant zebrafish myocytes by SB216763
(A to C) Effects of SB216763 on action potential parameters. (D and E) Effects of SB216763 on INa and IK1 current densities in control zebrafish ventricular myocytes and myocytes that expressed 2057del2 plakoglobin. Black, controls; red, myocytes expressing 2057del2 plakoglobin; blue, myocytes expressing 2057del2 plakoglobin and treated with SB216763. Numbers above bars in graphs indicate n for each condition. *P < 0.001 versus 2057del2 plakoglobin for (A), (B), and (E); **P < 0.002 versus 2057del2 plakoglobin for (C), unpaired t tests.
Fig. 5
Fig. 5. Modeling ACM in neonatal rat ventricular myocytes in vitro
(A) Representative image showing >90% transfection efficiency in neonatal rat ventricular myocytes transfected with a GFP-expressing adenoviral construct. (B) Western immunoblots showing equivalent levels of 2057del2 plakoglobin and endogenous plakoglobin in transfected cultures. 2057del2 plakoglobin migrates at a lower molecular weight than does the wild-type protein. Glyceraldehyde-3-phosphate dehydrogenase (GAPDH) was used as a loading control. (C and D) Representative confocal immunofluorescence images showing plakoglobin and Cx43 immunoreactive signal distribution in control cells and cells transfected with 2057del2 plakoglobin. (E) TUNEL labeling and caspase-3 activity in control myocytes and 2057del2 plakoglobin–expressing myocytes under rest conditions and after 4 hours of uniaxial cyclical stretch. White arrows point to apoptotic nuclei. Graphs show % TUNEL-stained nuclei in five microscopic fields. (*P < 0.01 versus resting controls; **P < 0.01 versus resting cells that expressed 2057del2 plakoglobin, two-tailed Student’s t tests), and caspase-3 assays were done in five cultures for each condition (*P < 0.05 versus resting controls; **P < 0.05 versus resting cells that expressed 2057del2 plakoglobin, two-tailed Student’s t tests). (F) TUNEL labeling of control cells and cells expressing 2057del2 plakoglobin under resting conditions and after 4 hours of stretch in the presence or absence of pifithrin-A. Graphs show % TUNEL-stained nuclei in five microscopic fields (n = 6; *P < 0.001 versus resting controls; **P < 0.001 versus resting cells that expressed 2057del2 plakoglobin; #P < 0.001 versus stretched cells that expressed 2057del2 plakoglobin, unpaired Student’s t tests), and caspase-3 assays were done in five cultures for each condition (*P < 0.05 versus resting controls; **P < 0.05 versus resting cells that expressed 2057del2 plakoglobin; #P < 0.001 versus stretched cells that expressed 2057del2 plakoglobin, unpaired Student’s t tests). (G) Cytokine expression profiles showing increased secretion of interleukin-6 (IL-6), tumor necrosis factor–α (TNF-α), macrophage inflammatory protein-1α (MIP-1α), and the chemokine RANTES (regulated on activation, normal T cell expressed and secreted) by neonatal rat ventricular myocytes that expressed 2057del2 plakoglobin compared to control cells.
Fig. 6
Fig. 6. Reversal of the disease phenotype in neonatal rat ventricular myocytes by SB216763
(A) Representative confocal immunofluorescence images showing normalization of plakoglobin and Cx43 immunoreactive signal distribution in neonatal rat ventricular myocytes treated with SB216763 (SB2). Images of untreated cells are the same as those shown in Fig. 5C because they were obtained from the same experiment. (B) Western immunoblots showing the total cellular content of plakoglobin and Cx43 in myocytes in the presence or absence of SB216763 (SB2) in control cells and cells that expressed 2057del2 plakoglobin. GAPDH was used as a loading control. (C) Effects of SB216763 (SB2) on TUNEL labeling in control myocytes and cells expressing 2057del2 plakoglobin. White arrows point to apoptotic nuclei. Graph shows %TUNEL-stained nuclei in 5 microscopic fields; n=6,*P<0.001versus controls; **P < 0.001 versus untreated cells that expressed 2057del2 plakoglobin; 2-tailed Student’s t-test. (D) Effects of SB216763 (SB2) treatment for 24 or 48 hours (hrs) on cytokine expression profiles in control cells and cells that expressed 2057del2 plakoglobin (IFNγ, interferon-γ; MIP-1γ, macrophage inflammatory protein-1γ; IP-10, interferon-γ-induced protein-10; IL-1ra, interleukin-1 receptor-a).
Fig. 7
Fig. 7. Abnormal distribution of SAP97 and Nav1.5 and its reversal by SB216763
(A) Representative confocal immunofluorescence images showing the distribution of SAP97 and Nav1.5 in control neonatal rat ventricular myocytes and myocytes that expressed 2057del2 plakoglobin in the presence or absence of SB216763. Arrows point to cell borders where differences in immunoreactive signals are most apparent. (B) Western immunoblots showing the total cellular content of SAP97 and Nav1.5 in control myocytes and myocytes that expressed 2057del2 plakoglobin in the presence or absence of SB216763. GAPDH was used as a loading control.
Fig. 8
Fig. 8. Effects of knockdown of SAP97 on the distribution of intercalated disc proteins in normal neonatal rat ventricular myocytes
Representative confocal immunofluorescence images showing the distribution of SAP97, Nav1.5, plakoglobin, Cx43, N-cadherin, plakophilin-2 (PKP2), and desmoplakin in control cells and neonatal rat ventricular myocytes infected with anti-SAP97 shRNA for 72 hours. Arrows point to cell borders where differences in immunoreactive signals are most apparent. Cultures treated with nonspecific shRNA were used as negative controls. shRNA treatment led to significant loss of SAP97 expression as shown by the marked reduction of SAP97 signals. Knockdown of SAP97 expression also significantly reduced signals for Nav1.5 and plakoglobin but not desmoplakin, plakophilin-2, N-cadherin, or Cx43.
Fig. 9
Fig. 9. Disease features in cardiac myocytes from iPSCs from two ACM probands with plakophilin-2 mutations
Representative confocal immunofluorescence images showing the distribution of plakoglobin, Cx43, Nav1.5, and SAP97 in iPSC-derived cardiac myocytes obtained from two ACM probands bearing mutations in the plakophilin-2 gene (family A: Q617X; family B: 2013delC) in the presence or absence of SB216763. Arrows point to cell borders where differences in immunoreactive signals are most apparent. iPSC-derived cardiac myocytes from unaffected nonmutation carrier siblings of the two AC probands were subjected to the same protocol and used for control purposes. Localization of all four proteins examined was disrupted in the ACM iPSC-derived cardiac myocytes but restored after treatment with SB216763 for 24 hours.

References

    1. Basso C, Corrado D, Marcus FI, Nava A, Thiene G. Arrhythmogenic right ventricular cardiomyopathy. Lancet. 2009;373:1289–1300. - PubMed
    1. Saffitz JE. The pathobiology of arrhythmogenic cardiomyopathy. Annu Rev Pathol. 2011;6:299–321. - PubMed
    1. Sen-Chowdhry S, Syrris P, Prasad SK, Hughes SE, Merrifield R, Ward D, Pennell DJ, McKenna WJ. Left-dominant arrhythmogenic cardiomyopathy: An under-recognized clinical entity. J Am Coll Cardiol. 2008;52:2175–2187. - PubMed
    1. Asimaki A, Tandri H, Huang H, Halushka MK, Gautam S, Basso C, Thiene G, Tsatsopoulou A, Protonotarios N, McKenna WJ, Calkins H, Saffitz JE. A new diagnostic test for arrhythmogenic right ventricular cardiomyopathy. N Engl J Med. 2009;360:1075–1084. - PubMed
    1. Asimaki A, Saffitz JE. Gap junctions and arrhythmogenic cardiomyopathy. Heart Rhythm. 2012;9:992–995. - PMC - PubMed

Publication types