. 2014 Jul 25;289(30):21163-80.
doi: 10.1074/jbc.M114.556365.

RNA granule assembly and disassembly modulated by nuclear factor associated with double-stranded RNA 2 and nuclear factor 45

RNA granule assembly and disassembly modulated by nuclear factor associated with double-stranded RNA 2 and nuclear factor 45

Nobuyuki Shiina et al. J Biol Chem. .

Abstract

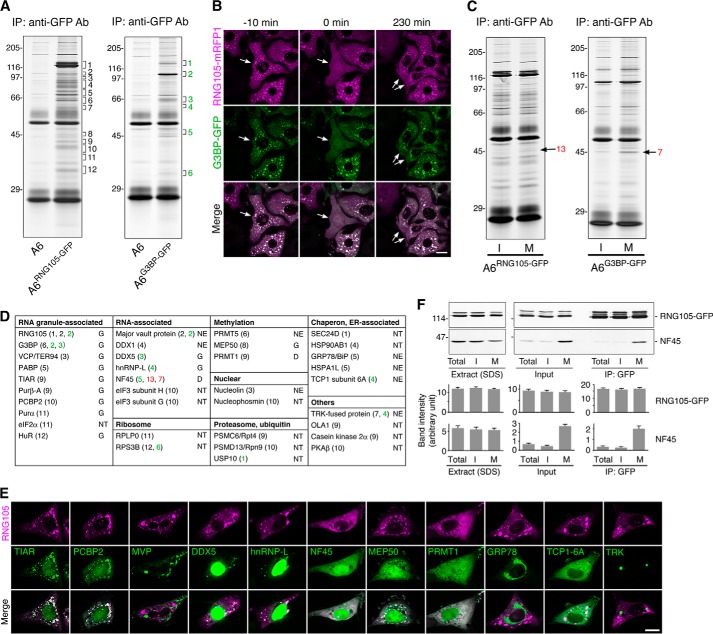
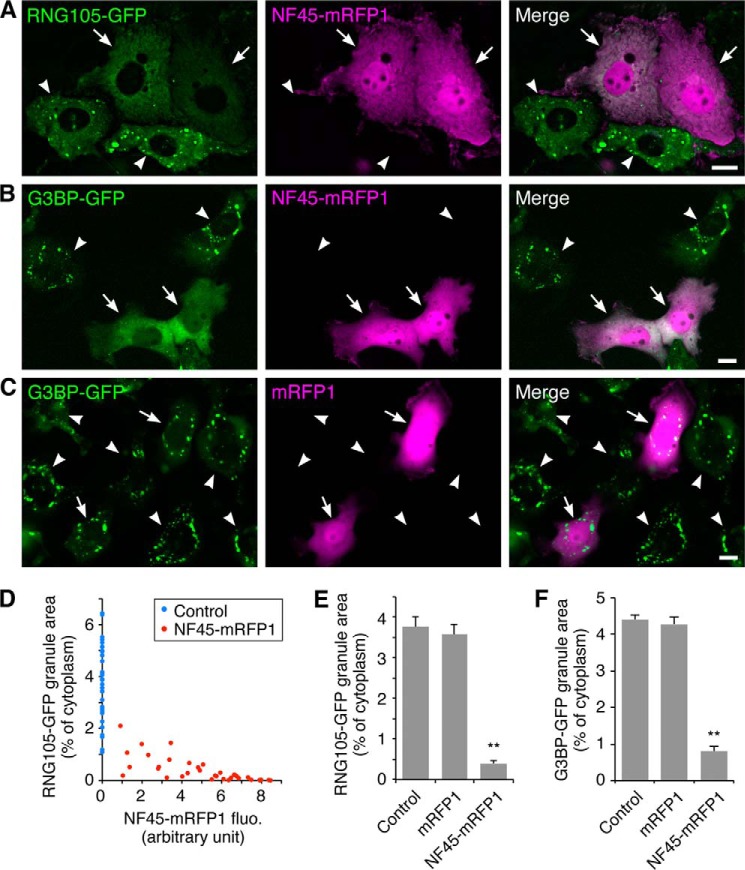
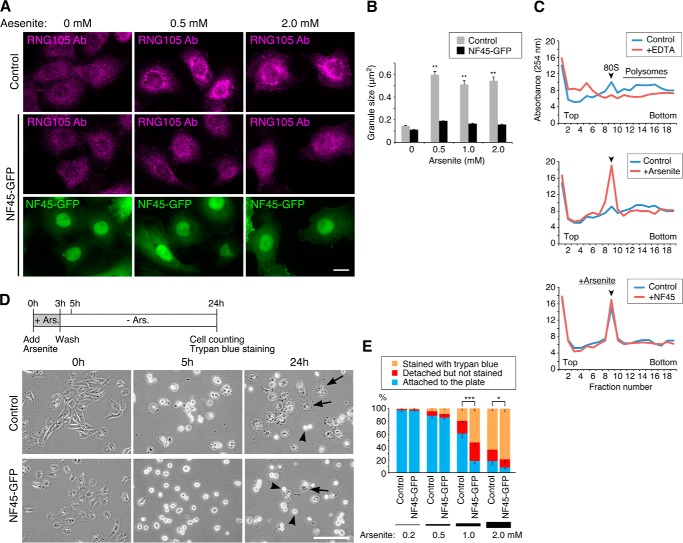
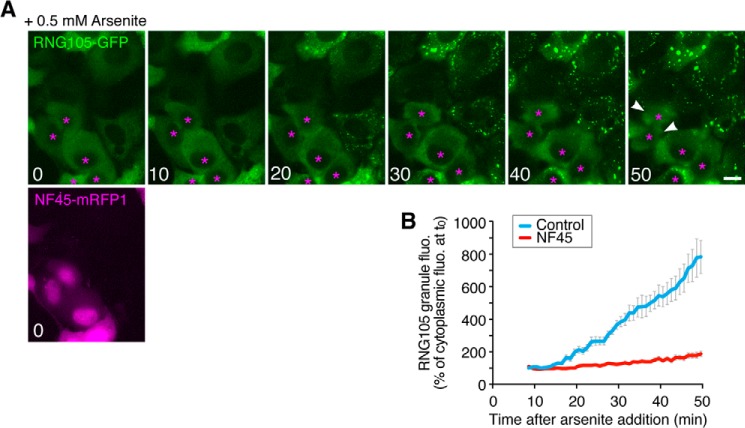
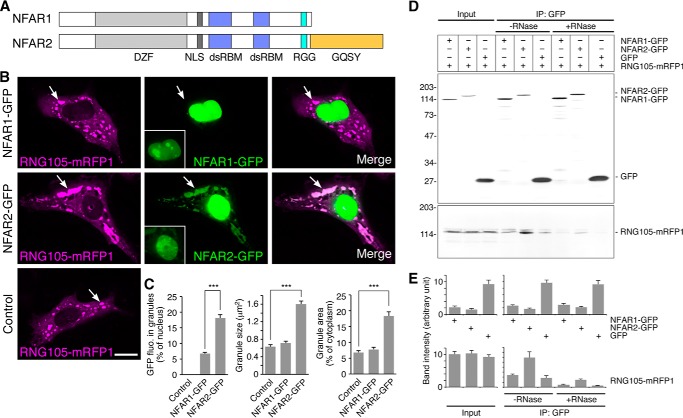
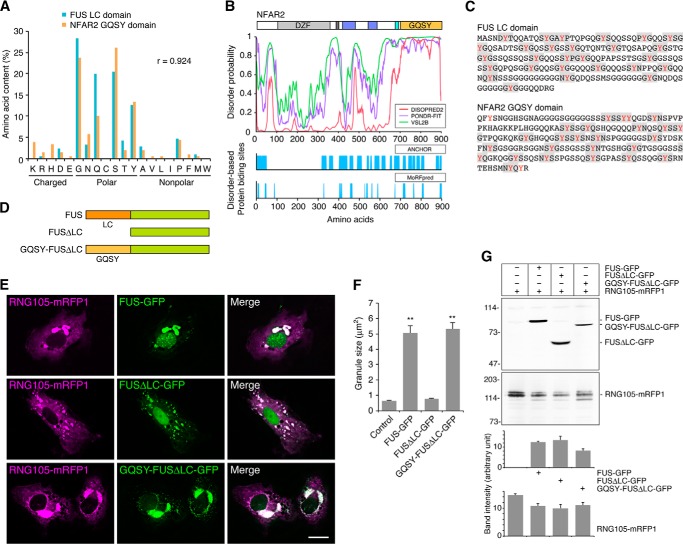
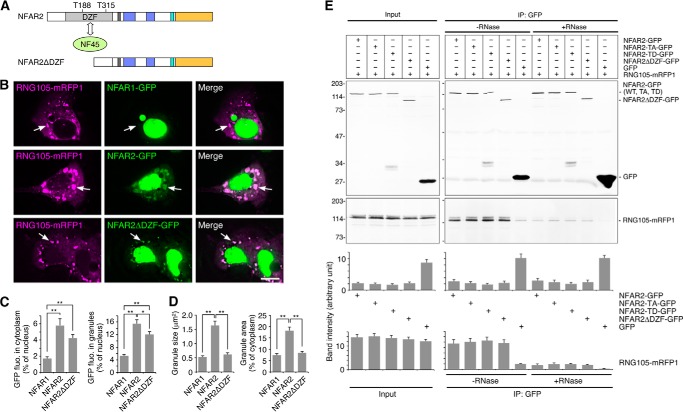
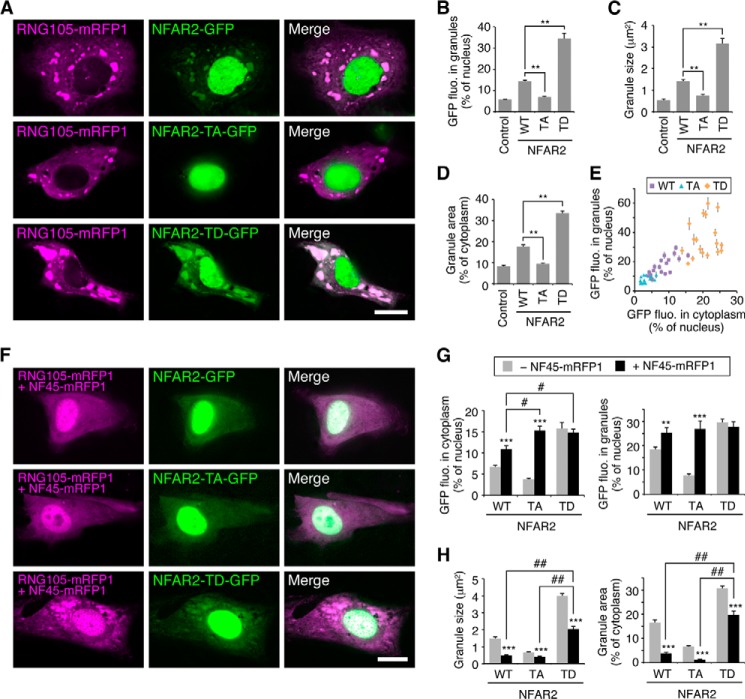
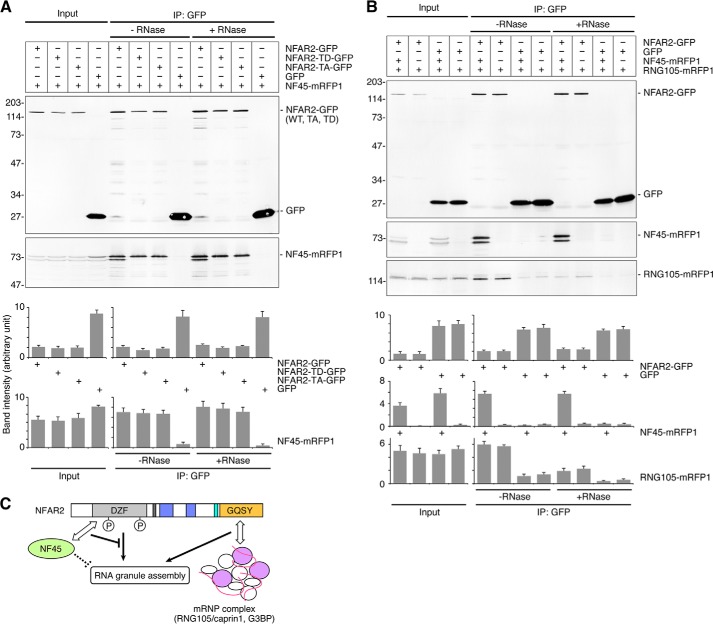
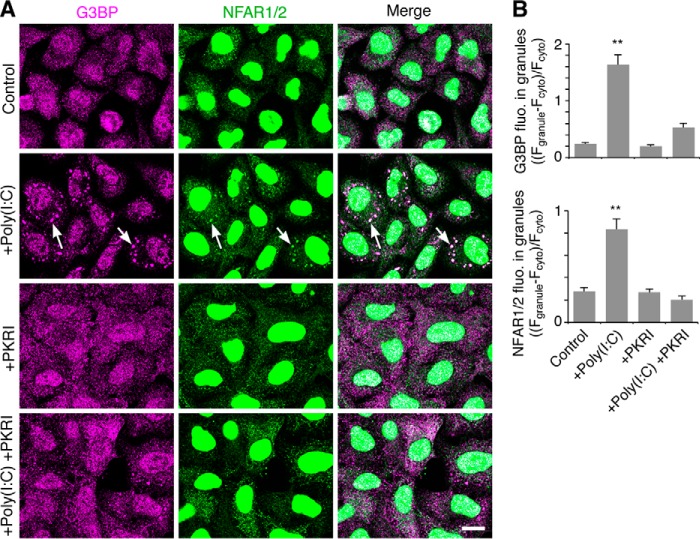
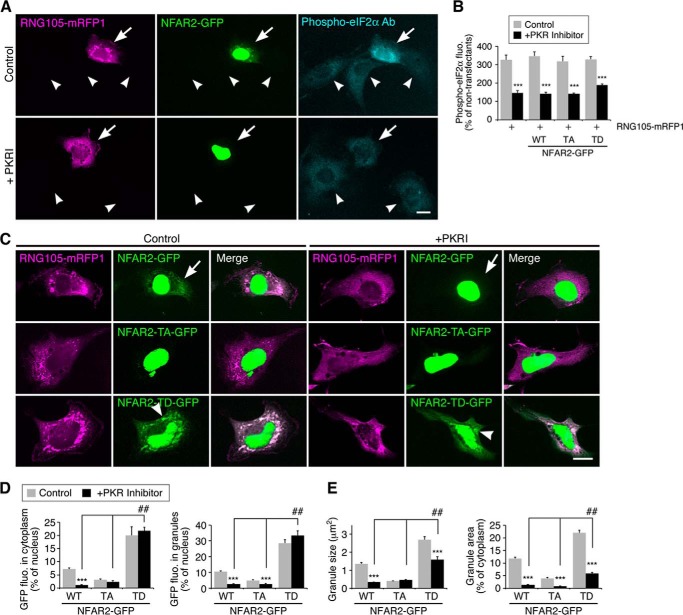
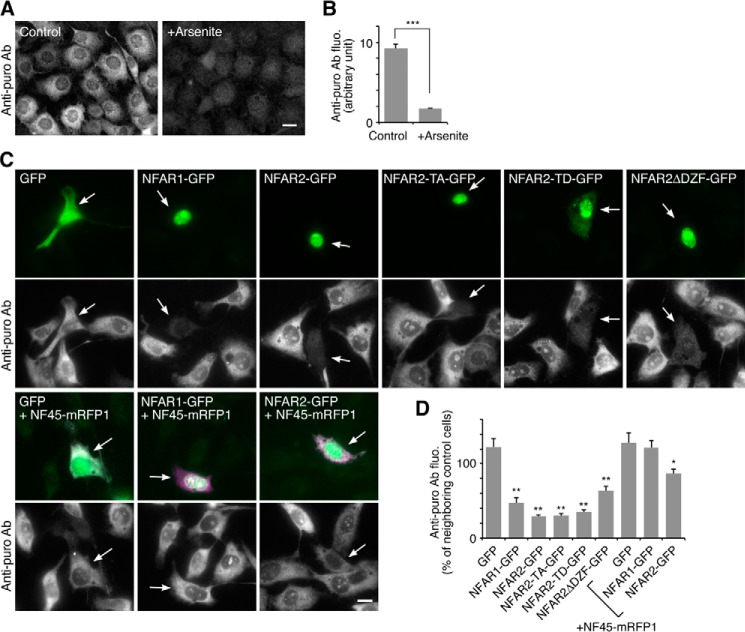
RNA granules are large messenger ribonucleoprotein complexes that regulate translation and mRNA translocation to control the timing and location of protein synthesis. The regulation of RNA granule assembly and disassembly is a structural basis of translational control, and its disorder is implicated in degenerative disease. Here, we used proteomic analysis to identify proteins associated with RNA granule protein 105 (RNG105)/caprin1, an RNA-binding protein in RNA granules. Among the identified proteins, we focused on nuclear factor (NF) 45 and its binding partner, nuclear factor associated with dsRNA 2 (NFAR2), and we demonstrated that NF45 promotes disassembly of RNA granules, whereas NFAR2 enhances the assembly of RNA granules in cultured cells. The GQSY domain of NFAR2 was required to associate with messenger ribonucleoprotein complexes containing RNG105/caprin1, and it was structurally and functionally related to the low complexity sequence domain of the fused in sarcoma protein, which drives the assembly of RNA granules. Another domain of NFAR2, the DZF domain, was dispensable for association with the RNG105 complex, but it was involved in positive and negative regulation of RNA granule assembly by being phosphorylated at double-stranded RNA-activated kinase sites and by association with NF45, respectively. These results suggest a novel molecular mechanism for the modulation of RNA granule assembly and disassembly by NFAR2, NF45, and phosphorylation at double-stranded RNA-activated kinase PKR sites.


Figures

FIGURE 1.
FIGURE 1.
Identification of RNG105- and G3BP-associated proteins. A, immunoprecipitates with an anti-GFP antibody (Ab) from control A6 cells and RNG105-GFP-expressing A6 cells (left panel) or G3BP-GFP-expressing A6 cells (right panel) were silver-stained after SDS-PAGE. Numbers on the left indicate molecular mass (kDa), and numbers on the right indicate gel regions cut and analyzed by mass spectrometry. B, fluorescence images of A6 cells co-expressing RNG105-mRFP1 and G3BP-GFP. Arrows indicate a cell undergoing mitosis at 0 min and then dividing into two daughter cells. Note that the cells were cultured in the absence of stressors. Scale bar, 10 μm. C, immunoprecipitates with the anti-GFP antibody from interphase (I) and mitotic (M) cells were silver-stained after SDS-PAGE. Left panel, RNG105-GFP-expressing A6 cells; right panel, G3BP-GFP-expressing A6 cells. Arrows indicate proteins whose amounts were higher in mitotic co-immunoprecipitates than in interphase. D, gel regions indicated in A and C were cut and analyzed by mass spectrometry. Identified proteins were classified according to their functions. Numbers correspond to the region numbers in A and C. The proteins were fused to GFP and expressed in A6 cells with RNG105-mRFP1 to test their co-localization with RNA granules and effects on RNA granules. The results are indicated on the right side. G, co-localized with RNA granules; D, promotes disassembly of RNA granules; NE, no effect on RNA granules; NT, not tested. E, representative images of A6 cells co-expressing the identified proteins fused to GFP and RNG105-mRFP1. Scale bar, 10 μm. F, input extracts, and the immunoprecipitates with the anti-GFP antibody from total, interphase (I), or mitotic (M) A6 cells expressing RNG105-GFP were immunoblotted with anti-GFP and anti-NF45 antibodies. Extracts with SDS-PAGE sample buffer were also blotted. Bottom panels show quantification of the band intensity of immunoblotting (n = 3).
FIGURE 2.
FIGURE 2.
NF45 promotes RNA granule disassembly. A–C, A6 cells stably expressing RNG105-GFP (A) or G3BP-GFP (B and C) were transfected with NF45-mRFP1 (A and B) or mRFP1 (C). Arrows and arrowheads denote NF45-mRFP1- or mRFP1-transfected and untransfected cells, respectively. The cells were cultured in the absence of stressors. Scale bars, 10 μm. D, dose-dependent effect of NF45-mRFP1 expression on RNG105-GFP granule disassembly. Control, untransfected neighboring cells. E and F, quantification of RNG105-GFP or G3BP-GFP granule area. n = 35; **p < 0.01, Tukey-Kramer test.
FIGURE 3.
FIGURE 3.
NF45 expression renders cells susceptible to stress. A, control A6 cells and stable transfectants with NF45-GFP were cultured with arsenite at the indicated concentrations for 1 h. The cells were immunostained with an anti-RNG105 antibody. Scale bar, 10 μm. B, mean size of RNG105 granules in A; n = 30; ** indicates p < 0.01, Tukey-Kramer test between 0 mm arsenite-treated control cells and indicated cells. C, polysome profiles analyzed by sucrose density gradient centrifugation. Shown are the absorbance profiles of fractions at 254 nm. Top panels, A6 cell extracts were treated without or with EDTA, which dissociated 80 S ribosomes into subunits and disassembled polysomes. Middle panels, A6 cells were cultured in the absence or presence of 0.5 mm arsenite for 1 h, which repressed translation and disassembled polysomes. Ribosomes dissociated from mRNA accumulated in the 80 S fractions. Bottom panels, control cells and NF45-GFP stable transfectants were cultured in the presence of 0.5 mm arsenite for 1 h. Polysome disassembly was not affected by expression of NF45-GFP. Arrowheads denote the peak of 80 S ribosomes. D, control A6 cells and NF45-GFP stable transfectants were cultured with 1.0 mm arsenite for 3 h. After removing arsenite, the cells were cultured for an additional 21 h. Phase contrast images were taken at 0, 5, and 24 h after arsenite addition. Arrows and arrowheads indicate cells attached to and detached from the culture plate, respectively. Scale bar, 100 μm. E, quantification of cell survival at 24 h after arsenite addition in D. Dead cells detached from the culture plates were detected by staining with trypan blue. n = 5 experiments; *, p < 0.05; ***, p < 0.005; χ2 test was performed on total cell numbers from the five experiments (>500 cells each).
FIGURE 4.
FIGURE 4.
NF45 reduces the assembly of arsenite-induced RNG105-localizing SGs. A, A6 cells stably expressing a low level of RNG105-GFP, which did not form RNA granules in basal condition, were transfected with NF45-mRFP1. The cells were stressed with 0.5 mm arsenite and viewed using a time-lapse fluorescence microscope. Numbers indicate time (minutes) after arsenite addition. Asterisks indicate cells transfected with NF45-mRFP1. Other cells are untransfected cells. Arrowheads denote cells detached from the coverslip. Scale bar, 10 μm. B, quantification of arsenite-induced assembly of RNG105-localizing SGs in A. Control, untransfected cells; NF45, NF45-mRFP1-transfected cells. n = 15.
FIGURE 5.
FIGURE 5.
NFAR2, but not NFAR1, co-localizes with and enlarges RNA granules. A, schematic diagram of the domain structure of NFAR1 and NFAR2. DZF, zinc finger nucleic acid binding domain; NLS, nuclear localization sequence; dsRBM, dsRNA-binding motif; RGG, Arg-Gly-Gly motif responsible for RNA binding; GQSY, Gly-, Gln-, Ser-, Tyr-rich domain. B, A6 cells were co-transfected with RNG105-mRFP1 and NFAR1-GFP (top panels), RNG105-mRFP1 and NFAR2-GFP (middle panels), or RNG105-mRFP1 alone (bottom panels). Arrows indicate RNG105-mRFP1 granules. The brightness of pictures was adjusted to show RNA granules distinctly, and the original images around nuclei used to quantify fluorescence intensity in C are shown in the insets. Scale bar, 10 μm. C, quantification of RNA granules in B. Fluorescence intensity of NFAR1-GFP and NFAR2-GFP in granules was normalized to that in the nucleus of the same cell. NFAR2-GFP was co-localized with granules and increased the mean size and the total area of granules in the cytoplasm. n = 30 cells; ***, p < 0.001, t test. D, IP from A6 cells co-expressing RNG105-mRFP1 and NFAR1-GFP, NFAR2-GFP, or GFP with the anti-GFP antibody in the presence or absence of RNase. Immunoprecipitates were immunoblotted with anti-GFP and anti-RFP antibodies. E, quantification of the band intensity in D. n = 3.
FIGURE 6.
FIGURE 6.
Structural and functional relation between the GQSY domain of NFAR2 and the LC sequence domain of FUS. A, high correlation of the amino acid composition between the mouse FUS LC sequence domain and the NFAR2 GQSY domain. Both domains are enriched with amino acids with polar side chains, especially Gly, Gln, Ser, and Tyr residues. B, top panel, structural disorder of the GQSY domain predicted by DISOPRED2, PONDR-FIT, and VSL2B predictors. Bottom panel, disorder-based potential binding sites predicted by ANCHOR and MoRFpred predictors. C, amino acid sequences of the FUS LC sequence domain and the NFAR2 GQSY domain. (G/S)Y(G/S) and similar motifs are highlighted. D, schematic diagram of the domain structure of FUS, FUSΔLC, and FUSΔLC fused to NFAR2 GQSY. E, A6 cells were co-transfected with RNG105-mRFP1 and FUS-GFP, FUSΔLC-GFP, or GQSY-FUSΔLC-GFP. Scale bar, 10 μm. F, quantification of RNG105-mRFP1 granule size in E. n = 30 cells; **p < 0.01; Tukey-Kramer test between control and indicated cells. G, immunoblotting of FUS-GFP proteins and RNG105-mRFP1 in the transfectants in E. Transfection efficiency was not significantly different among the cells as follows: 16.6 ± 1.3, 15.4 ± 1.2, 16.4 ± 2.4, and 17.6 ± 1.0% for control, FUS-GFP, FUSΔLC-GFP, and GQSY-FUSΔLC-GFP transfectants, respectively. Bottom panels show quantification of the band intensity of immunoblotting (n = 3).
FIGURE 7.
FIGURE 7.
NFAR2ΔDZF co-localizes with RNG105 RNA granules but loses the ability to enlarge RNA granules. A, schematic diagram of NFAR2ΔDZF. The DZF domain includes PKR phosphorylation sites (Thr-188 and Thr-315) and binds to NF45. B, A6 cells were co-transfected with RNG105-mRFP1 and NFAR1-GFP, NFAR2-GFP, or NFAR2ΔDZF-GFP. Arrows indicate RNG105-mRFP1 granules. Scale bar, 10 μm. C, quantification of cytoplasmic and granule localization of NFAR1-GFP, NFAR2-GFP, and NFAR2ΔDZF-GFP in B. D, quantification of the mean size and total area of RNG105-mRFP1 granules in B. n = 25; *, p < 0.05; **, p < 0.01, Tukey-Kramer test. E, IP from A6 cells co-expressing RNG105-mRFP1 and NFAR2-GFP, NFAR2-TA-GFP, NFAR2-TD-GFP, NFAR2ΔDZF-GFP, or GFP using the anti-GFP antibody in the presence or absence of RNase. Immunoprecipitates were immunoblotted with anti-GFP and anti-RFP antibodies. Bottom panels show quantification of the band intensity (n = 3).
FIGURE 8.
FIGURE 8.
Regulation of RNA granule assembly and disassembly through the DZF domain of NFAR2, phosphorylation mutants and NF45 association. A, both Thr-188 and Thr-315 in the DZF domain of NFAR2 were mutated to Ala or Asp in phosphodeficient (TA) or phosphomimetic (TD) mutants, respectively. A6 cells were co-transfected with RNG105-mRFP1 and NFAR2-GFP, NFAR2-TA-GFP, or NFAR2-TD-GFP. Scale bar, 10 μm. B–D, quantification of RNG105-mRFP1 granules in A. The TA mutant reduced its ability to localize to and enhance the assembly of RNG105 granules, whereas the TD mutant increased the ability compared with wild-type (WT) NFAR2. n = 25; **, p < 0.01, Tukey-Kramer test. E, correlation between cytoplasmic localization and granule localization of NFAR2-GFP and its mutants. r = 0.87, p = 2.68 × 10⁻²⁰. F, same experiments as A were performed except that the cells were additionally co-transfected with NF45-mRFP1. Although RNG105 and NF45 were visualized in the same color, RNG105 granules were distinguishable because of their bright signals. Essentially the same results were obtained by using NF45 without fluorescent protein tags. Scale bar, 10 μm. G, quantification of cytoplasmic and granule localization of NFAR2-GFP and its mutants in A and F. H, quantification of the mean size and total area of RNG105-mRFP1 granules in A and F. n = 25; **, p < 0.01; ***, p < 0.001, t test between NF45-mRFP1-transfected and -untransfected cells. #, p < 0.05; ##, p < 0.01, Tukey-Kramer test among NF45-mRFP1-transfected cells.
FIGURE 9.
FIGURE 9.
Binding of NF45 to NFAR2 does not affect the association between NFAR2 and RNG105 mRNP complexes. A, IP from A6 cells co-expressing NF45-mRFP1 and NFAR2-GFP, NFAR2-TD-GFP, NFAR2-TA-GFP, or GFP using the anti-GFP antibody in the presence or absence of RNase. Immunoprecipitates were immunoblotted with anti-GFP and anti-RFP antibodies. Lower bands of NF45-mRFP1 were detected in cell lysates (input) and the NFAR2-GFP immunoprecipitates, although the reasons are not known. B, IP with the anti-GFP antibody from A6 cells co-expressing RNG105-mRFP1 and NFAR2-GFP or GFP, which were additionally transfected with or without NF45-mRFP1. C, a model for the role of the GQSY and DZF domains of NFAR2 and NF45 in RNA granule assembly.
FIGURE 10.
FIGURE 10.
PKR-dependent RNA granule (SG) localization of NFAR1/2. A, HeLa cells were transfected with poly(I-C) to activate PKR and then cultured for 4 h in the absence or presence of PKR inhibitor (PKRI). The cells were co-immunostained for G3BP and NFAR1/2. Arrows denote SGs. Scale bar, 10 μm. B, quantification of the accumulation of G3BP and NFAR1/2 in SGs. Fluorescence intensity of G3BP and NFAR1/2 in SGs is normalized to that in the cytoplasm. n = 50; **, p < 0.01, Tukey-Kramer test between control and indicated cells.
FIGURE 11.
FIGURE 11.
PKR inhibition reduces the cytoplasmic and RNA granule localization of NFAR2, but not of NFAR2-TD. A, A6 cells co-transfected with RNG105-mRFP1 and NFAR2-GFP were cultured in the presence or absence of PKR inhibitor and stained with an anti-phospho-eIF2α antibody (Ab). Arrows and arrowheads indicate transfected and untransfected cells, respectively. Scale bar, 10 μm. B, quantification of phospho-eIF2α fluorescence intensity in transfectants expressing RNG105-mRFP1 with or without NFAR2-GFP or its mutants. Fluorescence intensity was normalized to that in untransfected neighboring cells. C, A6 cells co-expressing RNG105-mRFP1 and NFAR2-GFP or its mutants were cultured without (left panels) or with (right panels) PKR inhibitor. Arrows indicate cytoplasmic and granule localization of NFAR2-GFP, which was reduced by PKR inhibition. Arrowheads indicate cytoplasmic and granule localization of NFAR2-TD-GFP, which was not significantly affected by PKR inhibition. Scale bar, 10 μm. D, quantification of cytoplasmic and granule localization of NFAR2-GFP and its mutants in C. E, quantification of granules in the cells in C. n = 30; ***, p < 0.001, t test between control and PKR inhibitor-treated cells. ##, p < 0.01, Tukey-Kramer test among PKR inhibitor-treated cells.
FIGURE 12.
FIGURE 12.
Translational repression by NFAR1/2 and de-repression by NF45. A, A6 cells were analyzed by ribopuromycilation assay to measure translation in cells. Staining with an anti-puromycin antibody was reduced by treatment with 0.5 mm arsenite for 30 min. Scale bar, 10 μm. B, quantification of the cells in A. n = 32; ***, p < 0.001, t test. C, A6 cells expressing indicated proteins were analyzed by ribopuromycilation assay. Arrows denote transfected cells. Scale bar, 10 μm. D, quantification of anti-puromycin antibody staining of the transfectants in C. n = 30; *, p < 0.05; **, p < 0.01, Tukey-Kramer test between GFP-expressing cells (leftmost bar) and indicated cells.

Similar articles

Cited by

References

    1. Anderson P., Kedersha N. (2006) RNA granules. J. Cell Biol. 172, 803–808 - PMC - PubMed
    1. Kindler S., Wang H., Richter D., Tiedge H. (2005) RNA transport and local control of translation. Annu. Rev. Cell Dev. Biol. 21, 223–245 - PMC - PubMed
    1. Kiebler M. A., Bassell G. J. (2006) Neuronal RNA granules: movers and makers. Neuron 51, 685–690 - PubMed
    1. Sossin W. S., DesGroseillers L. (2006) Intracellular trafficking of RNA in neurons. Traffic 7, 1581–1589 - PubMed
    1. Martin K. C., Ephrussi A. (2009) mRNA localization: gene expression in the spatial dimension. Cell 136, 719–730 - PMC - PubMed

Publication types

MeSH terms

LinkOut - more resources