. 2014 Aug 8;289(32):21844-55.
doi: 10.1074/jbc.M114.558940. Epub 2014 Jun 11.

Insight into the architecture of the NuRD complex: structure of the RbAp48-MTA1 subcomplex

Affiliations

Insight into the architecture of the NuRD complex: structure of the RbAp48-MTA1 subcomplex

Saad S M Alqarni et al. J Biol Chem. .

Abstract

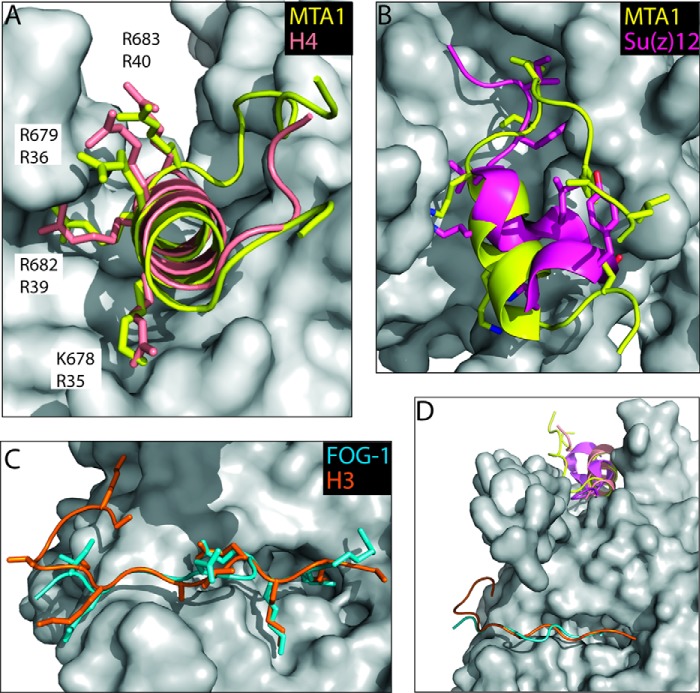
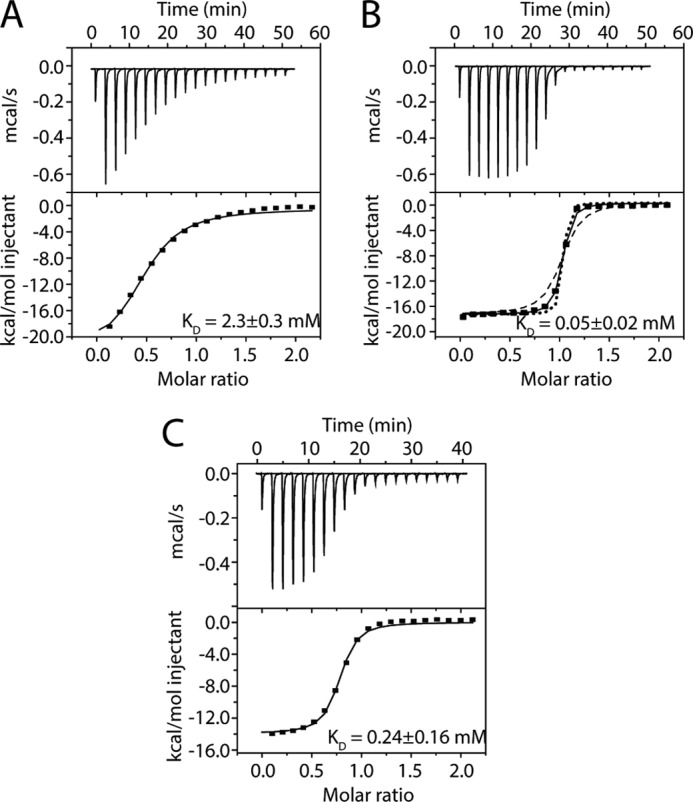
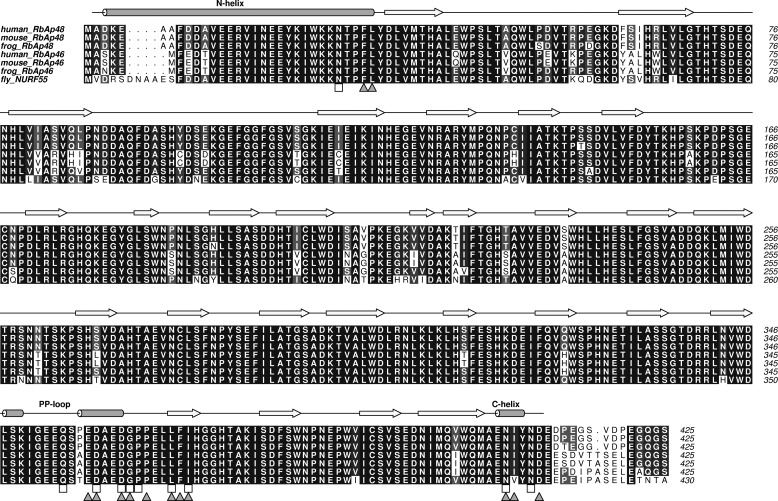
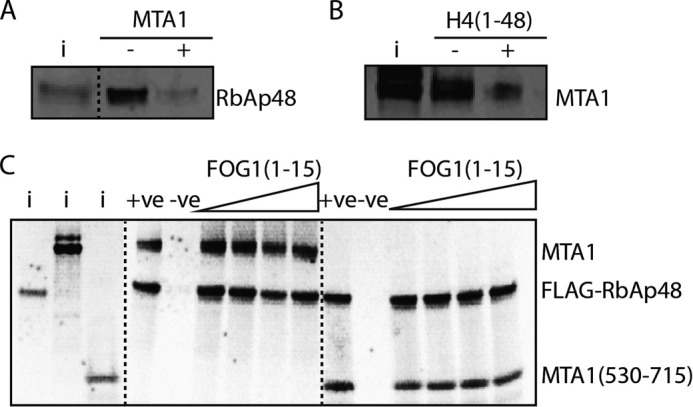
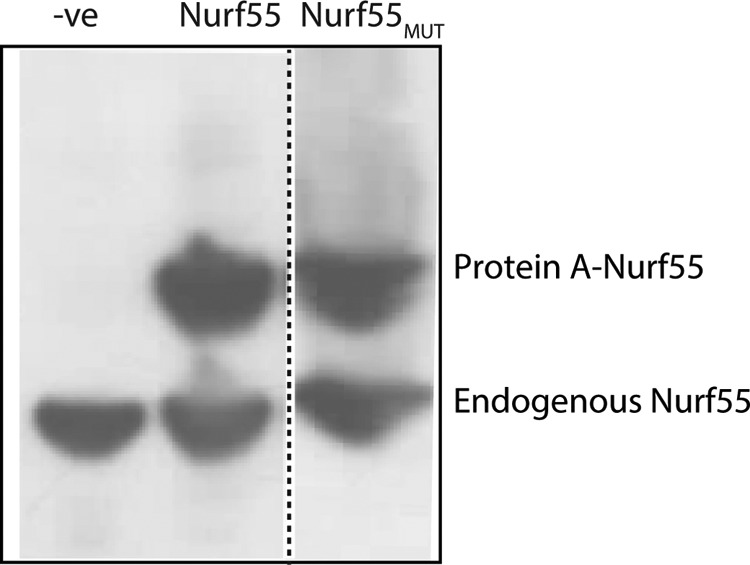
The nucleosome remodeling and deacetylase (NuRD) complex is a widely conserved transcriptional co-regulator that harbors both nucleosome remodeling and histone deacetylase activities. It plays a critical role in the early stages of ES cell differentiation and the reprogramming of somatic to induced pluripotent stem cells. Abnormalities in several NuRD proteins are associated with cancer and aging. We have investigated the architecture of NuRD by determining the structure of a subcomplex comprising RbAp48 and MTA1. Surprisingly, RbAp48 recognizes MTA1 using the same site that it uses to bind histone H4, showing that assembly into NuRD modulates RbAp46/48 interactions with histones. Taken together with other results, our data show that the MTA proteins act as scaffolds for NuRD complex assembly. We further show that the RbAp48-MTA1 interaction is essential for the in vivo integration of RbAp46/48 into the NuRD complex.

Keywords: Chromatin; Chromatin Structure; Gene Regulation; MTA1; NuRD Complex; Protein Assembly; Protein Structure; RBBP4; RbAp48.


Figures

FIGURE 1.
FIGURE 1.
Sequence alignment of MTA1, MTA2, and MTA3 from various eukaryotes. The alignment was produced using the ALINE program (64). Well defined domains are indicated. Uniprot accession numbers are: human MTA1 (Q13330), mouse MTA1 (Q8K4B0), rat MTA1 (Q62599), frog MTA1 (F6YJW8), fly MTA1 (Q9VNF6), human MTA2 (O94776), mouse MTA2 (Q9R190), rat MTA2 (B2GV01), frog MTA2 (Q4V7T0), human MTA3 (Q9BTC8), mouse MTA3 (Q924K8) and bovine MTA3 (A6QL72). The KRAARR motif is boxed in gray.
FIGURE 2.
FIGURE 2.
Mapping the region of MTA1 that binds RbAp48. A, schematic of the MTA1 constructs used in pulldown assays. B, pulldown assays using in vitro translated 35S-labeled FLAG-RbAp48 immobilized on anti-FLAG beads and in vitro translated 35S-labeled MTA1 constructs. Input is 10% of the amount used in each pulldown. A sample containing beads alone served as a negative control. Reactions were analyzed by SDS-PAGE and autoradiography. C, left hand panel, pulldown assays using in vitro translated 35S-labeled RbAp48 pulled down by bacterially expressed GST fusions of MTA1 fragments loaded onto glutathione-Sepharose beads. Input (i) refers to 10% of the amount of RbAp48 used in each pulldown, and the negative control (−ve) contains GST alone loaded onto beads. Protein (p) refers to RbAp48 protein that is pulled down in each case. Right hand panel: Coomassie blue-stained SDS-PAGE indicating the amount of either GST or GST-MTA1 (constructs 4 and 5) used.
FIGURE 3.
FIGURE 3.
X-ray crystal structures of RbAp48-MTA1-(656–686), RbAp48-MTA1-(670–695), and RbAp48-MTA1-(670–711). A, ribbon diagram showing a superposition of RbAp48-MTA1-(656–686), RbAp48-MTA1-(670–695), and RbAp48-MTA1-(670–711) over all Cα atoms. RbAp48 is shown in green, red, and gold, and the MTA1 peptides are shown in brown, yellow, and blue, respectively. The blades of RbAp48 are labeled numerically. B, surface/schematic view of RbAp48-MTA1-(670–695), indicating the elements of the RbAp48 structure that are contacted by MTA1. The structure is rotated 90° in the indicated direction relative to the orientation in part A. C, detail of the RbAp48-MTA1-(670–695) structure showing interactions made by the basic side chains of MTA1. Here, the structure is rotated 120° relative to its orientation in part A. D, hydrophobic interactions formed in the complex. Residues from RbAp48 are shown as red sticks, and MTA1 is shown in yellow.
FIGURE 4.
FIGURE 4.
Comparison of the RbAp48-MTA1 structure with other RbAp46/48 complex structures. A, comparison of interactions made by histone H4-(28–42) (PDB 3CFS, salmon) and MTA1-(670–695) (yellow) with RbAp46 (16) and RbAp48, respectively. Residues in MTA1 and H4 that make intermolecular contacts are shown as sticks. All of the interactions made by histone H4 are observed in the MTA1 structure. Key interacting residues of MTA1 together with the corresponding H4 residues are labeled. B, comparison of interactions made by Su(z)12-(79–91) (PDB 2YB8, magenta; Ref. 43) and MTA1-(670–695) (yellow) with Nurf55 and RbAp48, respectively. Residues in MTA1 and Su(z)12 that make intermolecular contacts are shown as sticks. C, comparison of interactions made by H3-(2–20) (PDB code 2YB8, orange; Ref. 43) and FOG-1-(1–15) (PDB code 2XU7, cyan; Ref. 17) with Nurf55 and RbAp48, respectively. D, overlay of RbAp46/48/Nurf55-MTA1/H4/Su(z)12/H3/FOG-1 complex structures. In all parts, RbAp48 is shown as a gray surface.
FIGURE 5.
FIGURE 5.
Measurement of the binding affinities of MTA1 peptides for RbAp48 by ITC. A, ITC profile for binding of an MTA1-(656–686) peptide to RbAp48. B, ITC profile for binding of an MTA1-(670–695) peptide to RbAp48. Simulated curves for affinities of 0.016 and 0.15 μm are shown to provide an indication of the reliability of the fit. C, ITC profile for binding of an MTA1-(670–711) peptide to RbAp48. In all cases data were fitted to a one-site model with a stoichiometry of 1:1. Titrations were carried out at 25 °C, and the data were fitted using Origin 7.0 and a standard 1:1 binding model (solid black line in the lower panel). Each titration was carried out in duplicate.
FIGURE 6.
FIGURE 6.
Sequence alignment of the WD40 proteins RbAp48 and RbAp46 from Homo sapiens, Mus musculus, and Xenopus tropicalis with D. melanogaster (Nurf55). Secondary structure (with reference to RbAp48) is denoted by arrows (β-strands) and cylinders (α-helices), and the MTA1 (squares) and H4 binding residues (triangles) are indicated.
FIGURE 7.
FIGURE 7.
Histone H3/FOG1 and MTA1 do not compete for binding to RbAp48. A, pulldown showing the binding of in vitro translated 35S-labeled RbAp48 to GST-histone H4-(1–48) (immobilized on glutathione beads) in the absence and presence of in vitro translated MTA1. B, pulldown showing the binding of in vitro translated 35S-labeled MTA1 to FLAG-RbAp48 (immobilized on anti-FLAG beads) in the absence and presence of histone H4-(1–48). C, pulldown assays showing the effect of adding increasing amounts of FOG1-(1–15) peptide to a complex formed between in vitro translated 35S-labeled FLAG-RbAp48 (immobilized on anti-FLAG beads) and in vitro translated 35S-labeled full-length MTA1 or MTA1-(530–715). The input (i) lane contains 10% of the 35S-labeled RbAp48, full-length MTA1, and MTA1-(530–715) proteins used in pulldown assays. The positive control (+ve) is 35S-labeled FLAG-RbAp48 and MTA1 without the FOG1-(1–15) peptide, and anti-FLAG beads plus MTA1 alone was used as the negative control (−ve).
FIGURE 8.
FIGURE 8.
A comparison of endogenous and protein A-tagged Nurf55. Western blot analysis to compare the expression levels of stably expressed protein A-tagged and endogenous Nurf55 in D. melanogaster Dmel-2 cells using an anti-p55/dCAF1 (ab1766) antibody at 1:5000 dilution.
FIGURE 9.
FIGURE 9.
A representation of the intracomplex and nucleosomal interactions of mammalian NuRD, facilitated by the RbAp48-MTA1 interaction. RbAp48 (red) interacts with MTA1 (yellow, this work) and also with the histone H3 tail (arrows; Refs. and 44). HDAC1/2 (green) interact with the MTA1 ELM+SANT domains (ES; Ref. 27). The BAH domain of MTA1 may also interact with nucleosomes (arrows + ?). HDAC1/2 remove acetyl groups on histone tails. MBD2/3 and p66a/b are shown in the background, as is CHD4 (domains from CHD4 also interact with nucleosomes but are not shown here for clarity (62, 63).

References

    1. Denslow S. A., Wade P. A. (2007) The human Mi-2/NuRD complex and gene regulation. Oncogene 26, 5433–5438 - PubMed
    1. McDonel P., Costello I., Hendrich B. (2009) Keeping things quiet: roles of NuRD and Sin3 co-repressor complexes during mammalian development. Int. J. Biochem. Cell Biol. 41, 108–116 - PMC - PubMed
    1. Miccio A., Wang Y., Hong W., Gregory G. D., Wang H., Yu X., Choi J. K., Shelat S., Tong W., Poncz M., Blobel G. A. (2010) NuRD mediates activating and repressive functions of GATA-1 and FOG-1 during blood development. EMBO J. 29, 442–456 - PMC - PubMed
    1. Ahringer J. (2000) NuRD and SIN3 histone deacetylase complexes in development. Trends Genet. 16, 351–356 - PubMed
    1. Smeenk G., Wiegant W. W., Vrolijk H., Solari A. P., Pastink A., van Attikum H. (2010) The NuRD chromatin-remodeling complex regulates signaling and repair of DNA damage. J. Cell Biol. 190, 741–749 - PMC - PubMed

Publication types

MeSH terms

LinkOut - more resources