. 2014 Aug;88(16):9458-71.
doi: 10.1128/JVI.01323-14. Epub 2014 Jun 11.

West nile virus-induced activation of mammalian target of rapamycin complex 1 supports viral growth and viral protein expression

Affiliations

West nile virus-induced activation of mammalian target of rapamycin complex 1 supports viral growth and viral protein expression

Katherine D Shives et al. J Virol. 2014 Aug.

Abstract

Since its introduction in New York City, NY, in 1999, West Nile virus (WNV) has spread to all 48 contiguous states of the United States and is now the leading cause of epidemic encephalitis in North America. As a member of the family Flaviviridae, WNV is part of a group of clinically important human pathogens, including dengue virus and Japanese encephalitis virus. The members of this family of positive-sense, single-stranded RNA viruses have limited coding capacity and are therefore obligated to co-opt a significant amount of cellular factors to translate their genomes effectively. Our previous work has shown that WNV growth was independent of macroautophagy activation, but the role of the evolutionarily conserved mammalian target of rapamycin (mTOR) pathway during WNV infection was not well understood. mTOR is a serine/threonine kinase that acts as a central cellular censor of nutrient status and exercises control of vital anabolic and catabolic cellular responses such as protein synthesis and autophagy, respectively. We now show that WNV activates mTOR and cognate downstream activators of cap-dependent protein synthesis at early time points postinfection and that pharmacologic inhibition of mTOR (KU0063794) significantly reduced WNV growth. We used an inducible Raptor and Rictor knockout mouse embryonic fibroblast (MEF) system to further define the role of mTOR complexes 1 and 2 in WNV growth and viral protein synthesis. Following inducible genetic knockout of the major mTOR cofactors raptor (TOR complex 1 [TORC1]) and rictor (TORC2), we now show that TORC1 supports flavivirus protein synthesis via cap-dependent protein synthesis pathways and supports subsequent WNV growth.

Importance: Since its introduction in New York City, NY, in 1999, West Nile virus (WNV) has spread to all 48 contiguous states in the United States and is now the leading cause of epidemic encephalitis in North America. Currently, the mechanism by which flaviviruses such as WNV translate their genomes in host cells is incompletely understood. Elucidation of the host mechanisms required to support WNV genome translation will provide broad understanding for the basic mechanisms required to translate capped viral RNAs. We now show that WNV activates mTOR and cognate downstream activators of cap-dependent protein synthesis at early time points postinfection. Following inducible genetic knockout of the major mTOR complex cofactors raptor (TORC1) and rictor (TORC2), we now show that TORC1 supports WNV growth and protein synthesis. This study demonstrates the requirement for TORC1 function in support of WNV RNA translation and provides insight into the mechanisms underlying flaviviral RNA translation in mammalian cells.


Figures

FIG 1
FIG 1
West Nile virus infection activates mTOR-dependent p70S6K. (A) Serum-fed Vero cells inoculated with WNV (+) or mock inoculum (−). At time zero postadsorption, Vero cells were treated with Akt inhibitor (Akt Inh) (Akt1/2) (10 μM) or vehicle control (DMSO) and harvested at 24 hpa for Western blot analysis using antibodies to p-p70S6K (T389) and p-mTOR (S2448). The positions of molecular mass markers (in kilodaltons) are indicated to the right of the blots. (B) Serum-starved Vero cells were inoculated with WNV or mock inoculated as described above for panel A and treated with 3MA (10 μM) or vehicle control (DMSO) at 0 hpa, and cells were harvested at 3 hpa. Whole-cell lysates were analyzed by Western blotting using antibodies to p-p70S6K (T389) and β-actin loading control. (C) Vero cells were starved of serum (−) for 12 h prior to infection with WNV (MOI of 3) and harvested at 3 hpa. A serum-fed (+) control of Vero cells was harvested at 2 h after mock infection. (D) Serum-fed (+) and serum-starved (−) BHK cells treated with insulin (100 mM) harvested at 2 h posttreatment. BHKs starved for 12 h, infected with WNV (MOI of 3), and harvested at 2 hpa and 3 hpa. (E) Cortical neurons preconditioned for 2 h without B27 supplement prior to infection, infected with WNV (MOI of 3), and harvested at 6 hpa. Values for mean band densitometry of p-p70 S6K were corrected for β-actin band density (n = 2). (F) Densitometry values for phospho-p70S6K normalized to total p70 from mock- and WNV-inoculated (MOI of 3) BHK cells and harvested at 3 hpa (n = 4). The values were significantly different (P = 0.05) by nonparametric t test with Welch correction as indicated by the bar and asterisk.
FIG 2
FIG 2
WNV activates TORC1 during infection. Serum-starved, Vero cells were inoculated with mock inoculum, WNV (MOI of 3) or UV-inactivated WNV (UV-WNV). Mock-inoculated, serum-fed controls were included. Cells were fixed at 3 hpa for immunocytochemistry analysis using antibodies to total mTOR (FITC; green), dsRNA (Cy3, red), and DAPI (blue) as a nuclear marker. Images acquired at 60× original magnification on an Olympus FV1000 confocal microscope. All images are representative of the images from three independent experiments.
FIG 3
FIG 3
WNV infection increases expression of p70 S6 kinase in serum-starved cells. Serum-starved, Vero cells were inoculated with mock inoculum, WNV (MOI of 3), or UV-inactivated WNV (UV-WNV). Mock-inoculated serum fed controls were included. Cells were fixed at 3 hpa for immunocytochemistry analysis using antibodies to p70S6K (fluorescein isothiocyanate [FITC] [green]), dsRNA (Cy3; red), and 4′,6′-diamidino-2-phenylindole (DAPI) (blue) as a nuclear marker. The images were acquired at magnification of ×60. All images are representative of three independent fields.
FIG 4
FIG 4
Pharmacologic inhibition of mTOR abrogates p70S6K activation in fed, primary neuron cultures at late time points. (A) Primary medium spiny neuron (MSN) cultures were treated with mTOR inhibitor (KU0063794 [KU]; 10 μM) following mock or WNV inoculation (MOI of 3). Neurons were harvested at 24 and 48 hpa, and whole-cell lysates were analyzed using Western blot with antibodies to phosphorylated p70S6K (p-p70S6K) (T389), total p70S6K, phosphorylated Akt (p-Akt) (S473), total Akt, and β-actin. The images are representative of the images from three independent experiments. (B) Primary cortical neuron cultures were treated, inoculated, and analyzed as described above. The images are representative of the images from three independent experiments.
FIG 5
FIG 5
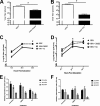
Pharmacologic inhibition of mTOR reduces WNV growth in primary neuron cultures. (A and B) Brain slice cultures (BSCs) were inoculated with WNV (104 PFU/slice) followed by treatment with rapamycin (Rapa) (1 μM) (A), KU (10 μM) (B), or vehicle control (DMSO) at 0 hpa. Viral titer was determined from washed BSC pellets at 72 h postadsorption. Values were significantly different (P < 0.05) as indicated by the bar and asterisk. (C and D) MSN cultures (C) and CORT cultures (D) were inoculated with WNV (MOI of 3) following treatment with KU (10 μM) or vehicle control (DMSO). Viral titer was determined by a standard plaque assay. Values that were significantly different (P < 0.05) are indicated by an asterisk. (E and F) MSN cultures (E) and cortical neuronal cultures (F) were inoculated and treated with KU or vehicle control as described above. At the indicated times, the MTT assay was completed and absorbance at 570 nm was measured for all samples (n = 3). A mock-infected, untreated control and cell-free medium were included as controls.
FIG 6
FIG 6
Inducible deletion of raptor or rictor prevents WNV-induced TORC1 and TORC2 activity, respectively. (A) Raptor knockout (iRapKO) and rictor knockout (iRicKO) MEF cells were mock induced with ethanol (EtOH) vehicle (−) or induced with 4OHT (+). Cells were harvested after induction for Western blot analysis of whole-cell lysates. Western blots were probed with antibodies to the indicated proteins. The images shown are representative of the images from three independent experiments. (B) Uninduced, control MEF cells were serum starved and inoculated with mock-infected, WNV-infected, or UV-inactivated WNV (UV-WNV). Whole-cell lysates were harvested at the indicated times postadsorption and analyzed by Western blotting using antibodies to phospho-p70S6K (T389), total p70S6K, and β-actin. (C and D) 4OHT-induced, raptor knockout MEF cells (iRapKO) (C) and 4OHT-induced, rictor knockout MEF cells (iRicKO) (D) were mock inoculated or inoculated with WNV and harvested for Western blot analysis at the time points indicated in the figure. Whole-cell lysates were analyzed using antibodies to raptor, rictor, p70S6K, Akt, p-p70S6K (T389), p-Akt (S473), and β-actin. The images are representative of the images from three independent experiments.
FIG 7
FIG 7
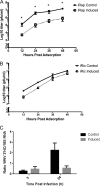
WNV growth is dependent on raptor expression. (A) Control, EtOH-induced MEF cells and 4OHT-induced iRapKO MEF cells were inoculated at 72 h postinduction with 1 × 10⁶ PFU/well of WNV (MOI of ∼1). Supernatants were harvested at the indicated times, and the viral titer was determined by a standard plaque assay. Values that were significantly different (P < 0.005) are indicated by an asterisk. (B) Control, EtOH-induced MEF cells and 4OHT-induced iRicKO MEF cells were inoculated after induction with 1 × 10⁶ PFU/well of WNV (MOI of ∼3). Values were not significantly different (ns) (P = 0.1) (nine or more replicate experiments). (C) Control, EtOH-induced MEF cells and 4OHT-induced iRapKO MEF cells were inoculated as described above. Cell pellets were harvested at the indicated time points for qRT-PCR analysis of WNV genome copy number normalized to 18S RNA expression levels (four replicate experiments for each condition).
FIG 8
FIG 8
Deletion of Raptor decreases WNV envelope and NS3 protein expression. (A and C) Control and induced iRapKO MEFs were inoculated at 72 h after induction with 1 × 10⁶ PFU WNV/well (MOI of ∼1) and harvested at the indicated times postadsorption. Western blot analysis of whole-cell lysates was completed using antibodies to WNV envelope protein (A), NS3 protein (C), and β-actin. The images are representative of the images from three independent experiments. (B and D) Control and induced iRicKO MEF cells were inoculated at 72 h postinduction with 1 × 10⁶ PFU WNV/well (MOI of ∼3) and harvested at the indicated times postadsorption. Western blot analysis of iRicKO whole-cell lysates was completed using antibodies to WNV envelope protein (B), NS3 protein (D), and β-actin. The images are representative of the images from three independent experiments.
FIG 9
FIG 9
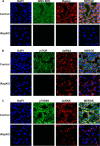
Deletion of Raptor inhibits WNV protein translation but not genomic replication. (A) EtOH-induced, control MEF cells and 4OHT-induced iRapKO MEF cells were inoculated with 1 × 10⁵ PFU WNV per well at 72 h postinduction and analyzed with immunocytochemistry at 24 hpa using antibodies to Raptor (FITC [green]) and WNV envelope (Cy3 [red]). (B) Under the same conditions as described above, cells were fixed and labeled with antibodies to mTOR (FITC [green]) and dsRNA (Cy3 [red]). (C) Under the same conditions as described above, cells were fixed and labeled with antibodies to p70S6K (FITC [green]) and dsRNA (Cy3 [red]). All panels are representative of the images from three independent experiments. DAPI (blue) was used as a nuclear marker in all panels.

References

    1. Jordan I, Briese T, Lipkin WI. 2000. Discovery and molecular characterization of West Nile virus NY 1999. Viral Immunol. 13:435–446. 10.1089/vim.2000.13.435 - DOI - PubMed
    1. Petersen LR, Hayes EB. 2008. West Nile virus in the Americas. Med. Clin. North Am. 92:1307–1322. 10.1016/j.mcna.2008.07.004 - DOI - PubMed
    1. Beatman E, Oyer R, Shives KD, Hedman K, Brault AC, Tyler KL, Beckham JD. 2012. West Nile virus growth is independent of autophagy activation. Virology 433:262–272. 10.1016/j.virol.2012.08.016 - DOI - PMC - PubMed
    1. Noda T. 1998. Tor, a phosphatidylinositol kinase homologue, controls autophagy in yeast. J. Biol. Chem. 273:3963–3966. 10.1074/jbc.273.7.3963 - DOI - PubMed
    1. Dann SG, Thomas G. 2006. The amino acid sensitive TOR pathway from yeast to mammals. FEBS Lett. 580:2821–2829. 10.1016/j.febslet.2006.04.068 - DOI - PubMed

Publication types

MeSH terms

Substances

LinkOut - more resources