. 2014 Aug;42(14):e110.
doi: 10.1093/nar/gku495. Epub 2014 Jun 11.

ARH-seq: identification of differential splicing in RNA-seq data

Affiliations

ARH-seq: identification of differential splicing in RNA-seq data

Axel Rasche et al. Nucleic Acids Res. 2014 Aug.

Abstract

The computational prediction of alternative splicing from high-throughput sequencing data is inherently difficult and necessitates robust statistical measures because the differential splicing signal is overlaid by influencing factors such as gene expression differences and simultaneous expression of multiple isoforms amongst others. In this work we describe ARH-seq, a discovery tool for differential splicing in case-control studies that is based on the information-theoretic concept of entropy. ARH-seq works on high-throughput sequencing data and is an extension of the ARH method that was originally developed for exon microarrays. We show that the method has inherent features, such as independence of transcript exon number and independence of differential expression, what makes it particularly suited for detecting alternative splicing events from sequencing data. In order to test and validate our workflow we challenged it with publicly available sequencing data derived from human tissues and conducted a comparison with eight alternative computational methods. In order to judge the performance of the different methods we constructed a benchmark data set of true positive splicing events across different tissues agglomerated from public databases and show that ARH-seq is an accurate, computationally fast and high-performing method for detecting differential splicing events.


Figures

Figure 1.
Figure 1.
Impact of alignment and read counting. ROC curves for differential splicing prediction comparing different junction alignment variants with respect to AEdb confirmed splicing events. Junction expression was computed with tophat (marked ‘_tophat’), MapSplice (marked ‘_MapSplice’), SpliceMap (marked ‘_SpliceMap’) and ‘synthetic’ junction windows (marked ‘_jctnWindowsBowtie’). Identified splice sites were mapped to Ensembl-annotated genes. ARH-seq predictions based solely on junction expression (marked ‘_jctn_’), exon expression (marked ‘_exon_’) and combination of both (combi-counts, marked ‘_combi_’) were compared. The left plot shows averaged pairwise tissue evaluations and the right plot the evaluation of the brain versus liver scenario with the ‘Illumina 75’ data set.
Figure 2.
Figure 2.
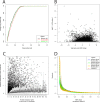
ARH-seq characteristics. (A) ARH-seq prediction performance for pairwise tissue comparisons on data sets generated with different sequence read lengths. (B) ARH-seq predictions (y-axis) versus gene expression changes (log2-scale; x-axis) in brain versus liver comparison. (C) ARH-seq predictions (y-axis) versus gene exon number (x-axis). All genes with the same exon number were summarized and according box plots of ARH-seq values for brain versus liver are shown. (D) Distribution of ARH-seq values plotted for all sequencing data sets. The resulting Weibull fit is superimposed as dashed line.
Figure 3.
Figure 3.
Methods comparison. (A) ROC curves for differential splicing prediction methods using ‘Illumina 75’ data set with all possible pairwise test cases (i.e. comparing one tissue against another tissue). (B) ROC curves assessing tissue-specific splicing events (i.e. comparing one tissue against all others). Due to highly variable sample sizes two methods had to be skipped. (C) ROC curves assessing differential splicing in brain versus liver. (D) Example of a detected true positive splicing event in the gene MPZL1. Exons are shown on the x-axis. RPKM values are visualized with the red dashed line for brain and blue solid line for liver. The splicing probabilities used for the entropy-based prediction are denoted as grey bars. Two exons known for splicing are marked with green dot-dashed lines. (E) AUC values for the different test cases including exon array results (pw = pairwise; ts = tissue specific; b2l = brain versus liver; EA = exon array data).
Figure 4.
Figure 4.
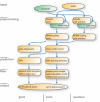
ARH-seq differential splicing prediction workflow. The proposed workflow starts with a set of sequencing reads and an Ensembl genome annotation and finally generates a set of spliced genes ordered by ARH-seq prediction scores. Reads are aligned to the genome with bowtie and counts are generated for exons and junction windows. Using RPKM-scaled values gene expression and combi-counts are calculated. Splicing prediction is performed with ARH-seq on the combi-counts. Spliced exons are judged by their splicing deviation. Finally, results are filtered by splicing strength and expression significance. Abbreviations: jctn, junction; nb, neighbouring.

References

    1. Stamm S., Ben-Ari S., Rafalska I., Tang Y., Zhang Z., Toiber D., Thanaraj T.A., Soreq H. Function of alternative splicing. Gene. 2005;344:1–20. - PubMed
    1. Melamud E., Moult J. Stochastic noise in splicing machinery. Nucleic Acids Res. 2009;37:4873–4886. - PMC - PubMed
    1. Pickrell J.K., Pai A.A., Gilad Y., Pritchard J.K. Noisy splicing drives mRNA isoform diversity in human cells. PLoS Genet. 2010;6:e1001236. - PMC - PubMed
    1. Kalsotra A., Cooper T.A. Functional consequences of developmentally regulated alternative splicing. Nat. Rev. Genet. 2011;12:715–729. - PMC - PubMed
    1. Pan Q., Shai O., Lee L.J., Frey B.J., Blencowe B.J. Deep surveying of alternative splicing complexity in the human transcriptome by high-throughput sequencing. Nat. Genet. 2008;40:1413–1415. - PubMed

Publication types

Associated data