Comparative Study
. 2014 Jun 12;10(6):e1003632.
doi: 10.1371/journal.pcbi.1003632. eCollection 2014 Jun.

Comparative analysis of human tissue interactomes reveals factors leading to tissue-specific manifestation of hereditary diseases

Affiliations
Comparative Study

Comparative analysis of human tissue interactomes reveals factors leading to tissue-specific manifestation of hereditary diseases

Ruth Barshir et al. PLoS Comput Biol. .

Abstract

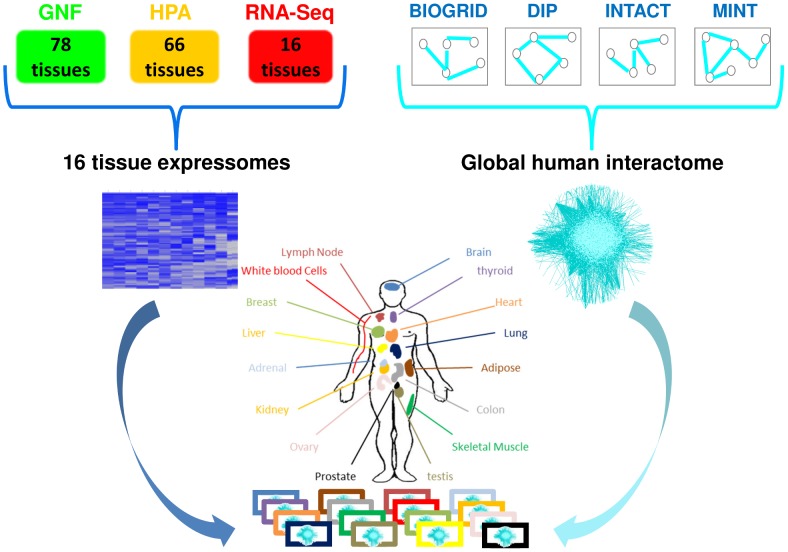
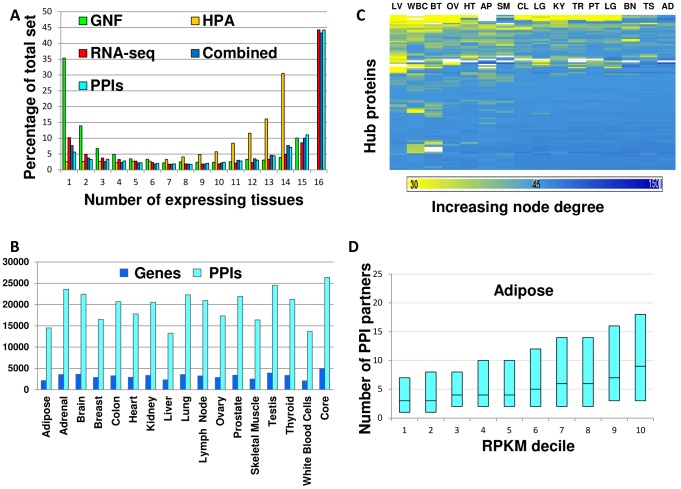
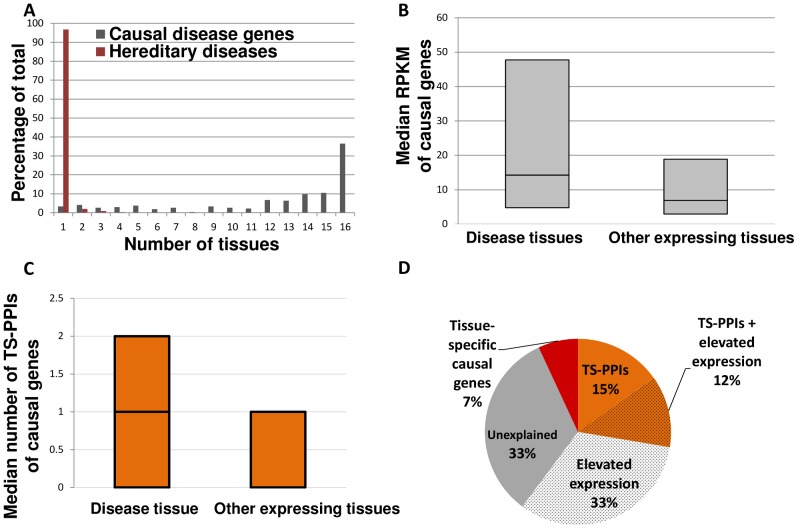
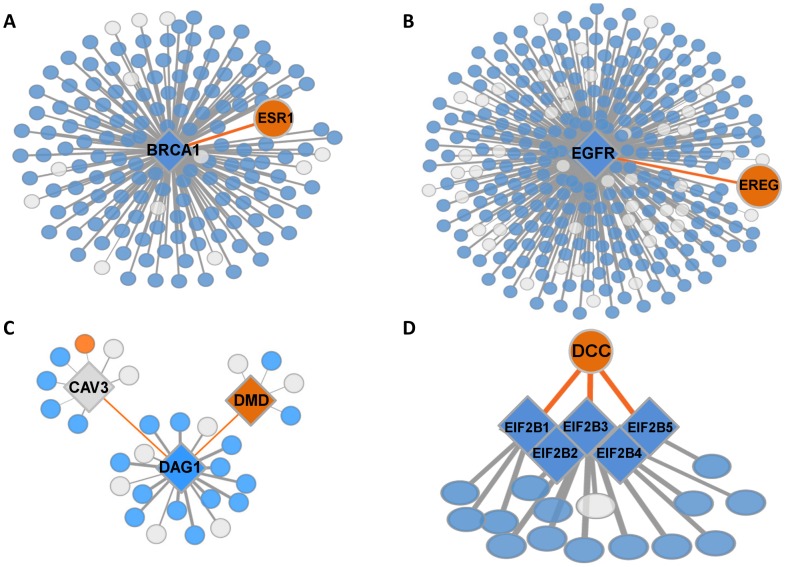
An open question in human genetics is what underlies the tissue-specific manifestation of hereditary diseases, which are caused by genomic aberrations that are present in cells across the human body. Here we analyzed this phenomenon for over 300 hereditary diseases by using comparative network analysis. We created an extensive resource of protein expression and interactions in 16 main human tissues, by integrating recent data of gene and protein expression across tissues with data of protein-protein interactions (PPIs). The resulting tissue interaction networks (interactomes) shared a large fraction of their proteins and PPIs, and only a small fraction of them were tissue-specific. Applying this resource to hereditary diseases, we first show that most of the disease-causing genes are widely expressed across tissues, yet, enigmatically, cause disease phenotypes in few tissues only. Upon testing for factors that could lead to tissue-specific vulnerability, we find that disease-causing genes tend to have elevated transcript levels and increased number of tissue-specific PPIs in their disease tissues compared to unaffected tissues. We demonstrate through several examples that these tissue-specific PPIs can highlight disease mechanisms, and thus, owing to their small number, provide a powerful filter for interrogating disease etiologies. As two thirds of the hereditary diseases are associated with these factors, comparative tissue analysis offers a meaningful and efficient framework for enhancing the understanding of the molecular basis of hereditary diseases.


Conflict of interest statement

The authors have declared that no competing interests exist.

Figures

Figure 1
Figure 1. The construction of 16 human tissue interactomes by integrating data of tissue expression with data of PPIs.
Data of expression per tissue according to DNA microarray (GNF, [12]), protein abundance (HPA, [14]), and RNA-sequencing (RNA-seq, [15]) were consolidated into 16 main tissues. In parallel, experimentally detected PPIs were united from BIOGRID , DIP , IntAct and MINT to form a global human interactome. Tissue interactomes were then constructed by filtering the global interactome per tissue to contain only PPIs in which both pair-mates were found to be expressed within the tissue.
Figure 2
Figure 2. Common features of tissue interactomes.
A. The distribution of proteins and PPIs by the number of tissues in which they are expressed is bi-modal, with most genes being globally expressed or tissue-specific. The distribution is shown per dataset and when combined. PPIs show a corresponding bi-modal distribution (the numbers of PPIs across 1–16 tissues appear in Table S11). B. A comparative view of the numbers of expressed proteins and PPIs across tissues. The core sub-network that is shared by all tissues (the right-most bar) is larger than the interactome of each tissue that remains after excluding the core. The numbers of genes and PPIs in the interactome of each tissue appear in Table S12. C. Most tissue hubs are widely expressed and retain their large PPI degree when expressed. The PPI degrees of the 451 tissue hubs (rows) in the 16 tissue interactomes (columns) are presented using a heat map, where each entry marks the PPI degree of the corresponding hub in that tissue. Entries are colored by the PPI degree from yellow (≤30 PPIs) to dark blue (≥150 PPIs); a white entry implies that the hub is not expressed in that tissue. Tissue acronyms: LV = Liver, WBC = White Blood Cells, BT = Breast, OV = Ovary, HT = Heart, AP = Adipose, SM = Skeletal Muscle, CL = Colon, LG = Lung, KY = Kidny, TR = Thyroid, PT = Prostate, LG = Lung, BN = Brain, TS = Testis, AD = Adrenal. D. A strong correlation between RPKM levels and PPI degree is observed in adipose tissue (Spearman r = 0.98, p = 4.7*10−7). The box-plot diagram shows the quartiles (25%, 50% and 75%) of the sorted PPI degree values in each RPKM bin. Similar correlations were observed in all 16 tissues (Figure S3).
Figure 3
Figure 3. Tissue-related features of hereditary diseases and their causal genes.
A. The tissue-distribution of hereditary diseases and their causal genes shows that diseases are manifested in few tissues, while most of their germline-aberrant causal genes are expressed in 10 tissues or more. The numbers of expressed causal genes across 1–16 tissues appear in Table S13. B. Causal genes tend to be more highly expressed in their disease tissues relative to other tissues in which they are expressed. We observed higher median expression levels in disease tissues for 128 out of the 203 germline-aberrant causal genes for which RPKM values were available (p-value<10−4). The box-plot diagram shows the quartiles (25%, 50% and 75%) of the median RPKM levels of causal genes; for each gene only tissues expressing the gene were considered. C. Causal genes involved in TS-PPI tend to have more TS-PPI in their disease tissues relative to other tissues. Out of 126 genes with TS-PPI, 58 genes had higher median TS-PPI in the disease tissue relative to non-disease tissues in which they are expressed (p-value<10−4). The box-plot diagram shows the quartiles (25%, 50% and 75%) of the median number of TS-PPI of causal genes, where for each gene only tissues expressing the gene were considered. The first (25%) and second (50%) quartiles of non-disease tissues were zero and therefore overlap with the X axis. D. The majority of the 303 hereditary diseases are associated with elevated expression and/or TS-PPIs of their causal genes in their disease tissues.
Figure 4
Figure 4. TS-PPIs illuminate disease-related tissue-specific effects of causal genes.
Orange, blue and grey nodes denote tissue-specific, globally-expressed, and other proteins, respectively; diamond nodes mark hereditary disease genes; edges denote PPIs. A. BRCA1 is a globally-expressed tumor-suppressor hub, and ESR1 is an estrogen receptor protein that activates cellular proliferation. The breast-specific PPI linking BRCA1 and ESR1 provides a potential basis for the breast-specific effects of BRCA1 germline mutations . B. A lung-specific PPI connects the widely-expressed epidermal growth factor receptor EGFR and its ligand protein epiregulin (EREG). Germline mutations in EGFR lead to lung cancer , and EREG was shown to confer invasive properties in an EGFR-dependent manner . C. Muscle-specific PPIs connect the widely expressed trans-membrane cell adhesion receptor dystroglycan 1 (DAG1) to its muscle-specific ligand dystrophin (DMD), and to caveolin 3 (CAV3) which regulates DMD by preventing the DAG1-DMD PPI. Mutations in all three genes give rise to various forms of muscular dystrophies. D. The brain-specific PPIs that link members of the globally-expressed protein complex EIF2B to the netrin-1-receptor DCC may underlie the brain-specific effects of germline mutations in EIF2B complex members .

References

    1. Amberger J, Bocchini CA, Scott AF, Hamosh A (2009) McKusick's Online Mendelian Inheritance in Man (OMIM). Nucleic Acids Res 37: D793–796. - PMC - PubMed
    1. Gregersen N, Bross P, Vang S, Christensen JH (2006) Protein misfolding and human disease. Annu Rev Genomics Hum Genet 7: 103–124. - PubMed
    1. Lage K, Hansen NT, Karlberg EO, Eklund AC, Roque FS, et al. (2008) A large-scale analysis of tissue-specific pathology and gene expression of human disease genes and complexes. Proc Natl Acad Sci U S A 105: 20870–20875. - PMC - PubMed
    1. Reverter A, Ingham A, Dalrymple BP (2008) Mining tissue specificity, gene connectivity and disease association to reveal a set of genes that modify the action of disease causing genes. BioData Min 1: 8. - PMC - PubMed
    1. Dezso Z, Nikolsky Y, Sviridov E, Shi W, Serebriyskaya T, et al. (2008) A comprehensive functional analysis of tissue specificity of human gene expression. BMC Biol 6: 49. - PMC - PubMed

Publication types