. 2014 Jun 12;10(6):e1003635.
doi: 10.1371/journal.pcbi.1003635. eCollection 2014 Jun.

Spatial Transmission of 2009 Pandemic Influenza in the US

Affiliations

Spatial Transmission of 2009 Pandemic Influenza in the US

Julia R Gog et al. PLoS Comput Biol. .

Abstract

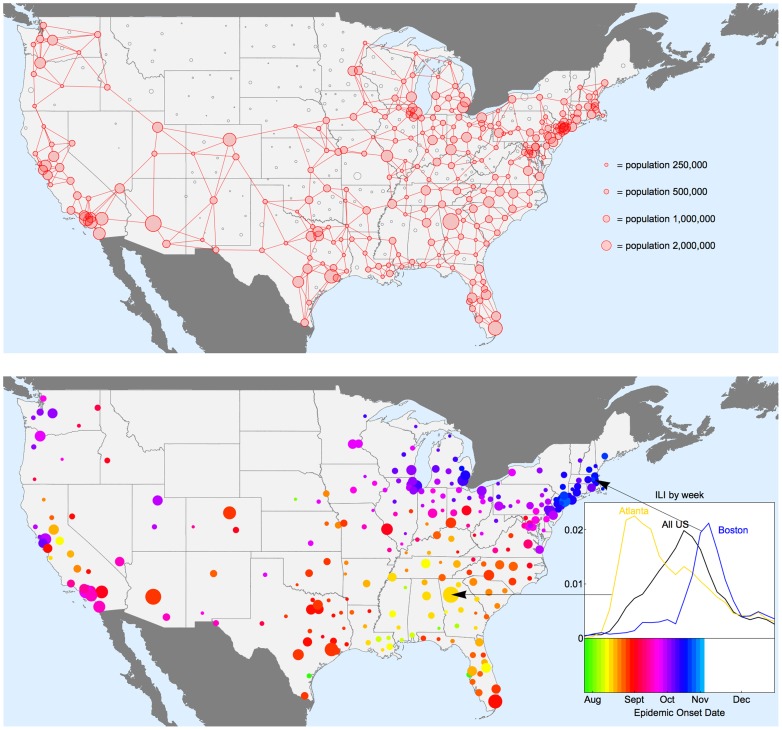
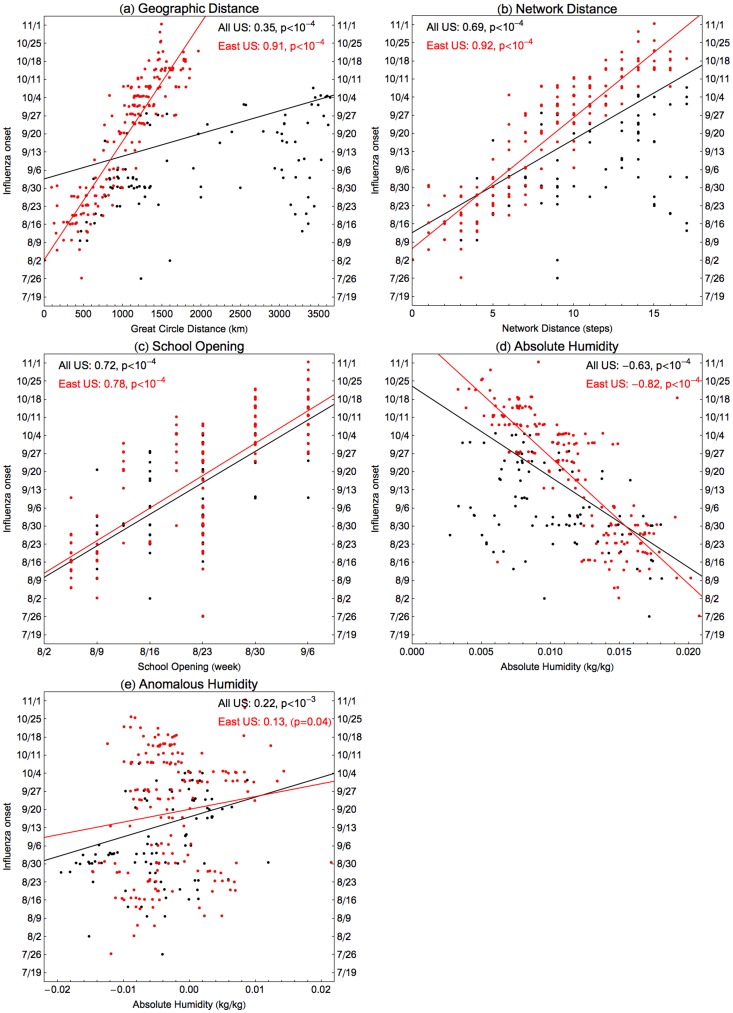
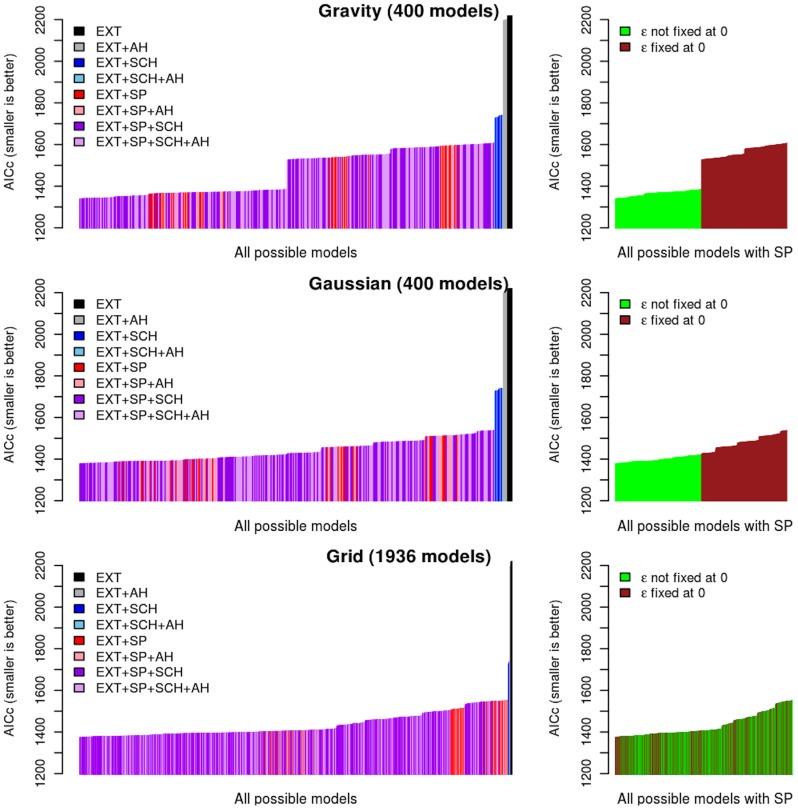
The 2009 H1N1 influenza pandemic provides a unique opportunity for detailed examination of the spatial dynamics of an emerging pathogen. In the US, the pandemic was characterized by substantial geographical heterogeneity: the 2009 spring wave was limited mainly to northeastern cities while the larger fall wave affected the whole country. Here we use finely resolved spatial and temporal influenza disease data based on electronic medical claims to explore the spread of the fall pandemic wave across 271 US cities and associated suburban areas. We document a clear spatial pattern in the timing of onset of the fall wave, starting in southeastern cities and spreading outwards over a period of three months. We use mechanistic models to tease apart the external factors associated with the timing of the fall wave arrival: differential seeding events linked to demographic factors, school opening dates, absolute humidity, prior immunity from the spring wave, spatial diffusion, and their interactions. Although the onset of the fall wave was correlated with school openings as previously reported, models including spatial spread alone resulted in better fit. The best model had a combination of the two. Absolute humidity or prior exposure during the spring wave did not improve the fit and population size only played a weak role. In conclusion, the protracted spread of pandemic influenza in fall 2009 in the US was dominated by short-distance spatial spread partially catalysed by school openings rather than long-distance transmission events. This is in contrast to the rapid hierarchical transmission patterns previously described for seasonal influenza. The findings underline the critical role that school-age children play in facilitating the geographic spread of pandemic influenza and highlight the need for further information on the movement and mixing patterns of this age group.


Conflict of interest statement

The authors have declared that no competing interests exist.

Figures

Figure 1
Figure 1. Geographic patterns of pandemic onset timings in studied locations in the 48 contiguous US states, autumn 2009.
Upper panel: The map shows how the available influenza-like-illness (ILI) data are spatially stratified by 449 locations according to postal sectional center facility (SCF). The areas of the circles are proportional to population size. Locations in red are included in the analysis below, while those in black are excluded either due to small population size, or low reporting of ILI cases during 2009. See methods for neighbour network construction. Lower panel: Map of estimated timing of fall pandemic onset for the 271 locations with sufficient sampling for use in subsequent statistical and modelling analyses. These locations span 90% of the US population. There is a clear spatial spread visible for much of the US, with influenza pandemic onset earliest for the South Eastern states, and latest in the North East. Some places do not fit this overall pattern, and the distribution of timings on the west coast is more complex. The inset plot shows the proportion ILI during the fall wave of 2009 for the whole of the US aggregated (black), Atlanta (Yellow) and Boston (Blue): the aggregated ILI curve masks the relative sharp upswing in cases for individual locations as the pandemic onset timing differs considerably between locations.
Figure 2
Figure 2. Univariate correlations between autumn 2009 pandemic onset timings and potentially contributing factors.
The influenza onset timings are on the vertical axes for all four plots, and red points are locations in HHS regions 1–5 (East) and black in regions 6–10 (West). These are correlated either as East only (in red) or all US (in black) against four different candidate explanatory variables: (a) Distance from the earliest location in Alabama as measured by great circle geographic distance, (b) distance measured as minimum number of steps on the neighbour network, (c) the timing of fall school openings for the state and (d) absolute humidity and (e) humidity anomalies in the 7–10 days prior pandemic onset. See methods for details. Correlation coefficients and significance are inset in each plot. All of these correlations are highly significant (p<10−4).
Figure 3
Figure 3. Parsimony of model fits to the autumn 2009 pandemic onset timings – corrected Akaike information criteria (AICc) histograms for all models.
Left panels: AICc per categories (EXT: External seeding; AH: Absolute Humidity; SCH: Schools; SP: Space). Each vertical line represents one possible model. Right panels: AICc for models containing parameters related to space (SP) segregated regarding the assumption made on density dependence in connectivity between SCFs.

References

    1. Cliff AD, Haggett P, Smallman-Raynor M (1998) Deciphering global epidemics: analytical approaches to the disease records of world cities, 1888–1912; Press BU, editor. Cambridge. - PubMed
    1. Grenfell BT, Bjornstad ON, Kappey J (2001) Travelling waves and spatial hierarchies in measles epidemics. Nature 414: 716–723. - PubMed
    1. Viboud C, Bjornstad ON, Smith DL, Simonsen L, Miller MA, et al. (2006) Synchrony, waves, and spatial hierarchies in the spread of influenza. Science 312: 447–451. - PubMed
    1. Chowell G, Bettencourt LM, Johnson N, Alonso WJ, Viboud C (2008) The 1918–1919 influenza pandemic in England and Wales: spatial patterns in transmissibility and mortality impact. Proc Biol Sci 275: 501–509. - PMC - PubMed
    1. Eggo RM, Cauchemez S, Ferguson NM (2011) Spatial dynamics of the 1918 influenza pandemic in England, Wales and the United States. J R Soc Interface 8: 233–243. - PMC - PubMed

Publication types