. 2014 Jun 12;10(6):e1004400.
doi: 10.1371/journal.pgen.1004400. eCollection 2014 Jun.

JNK controls the onset of mitosis in planarian stem cells and triggers apoptotic cell death required for regeneration and remodeling

Affiliations

JNK controls the onset of mitosis in planarian stem cells and triggers apoptotic cell death required for regeneration and remodeling

María Almuedo-Castillo et al. PLoS Genet. .

Erratum in

Abstract

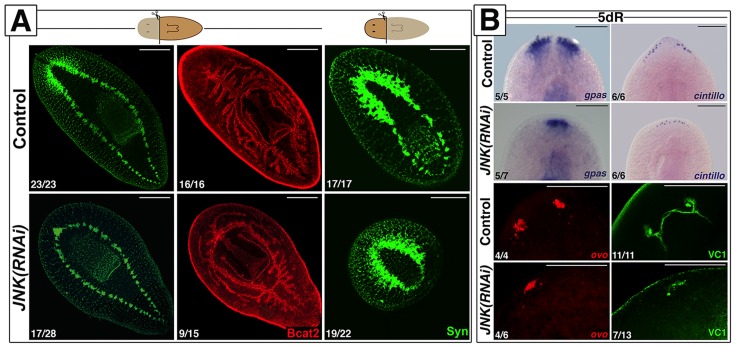
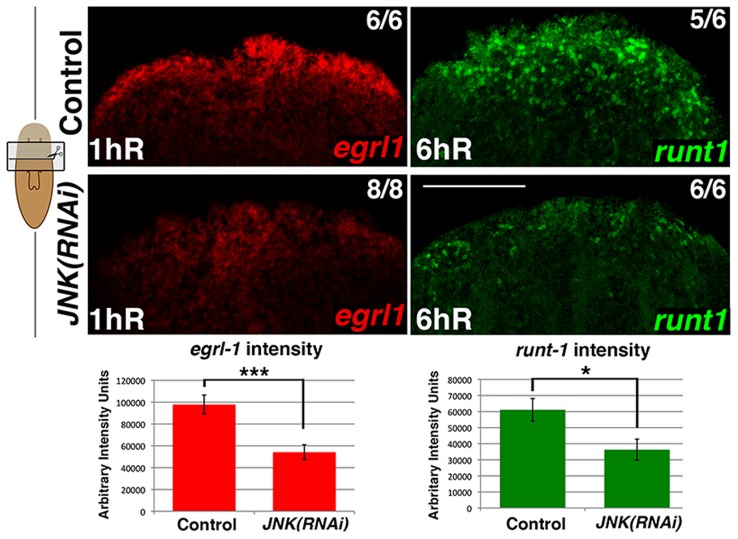
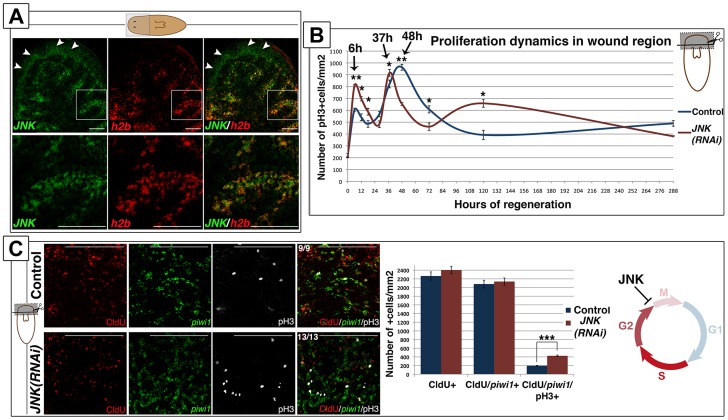
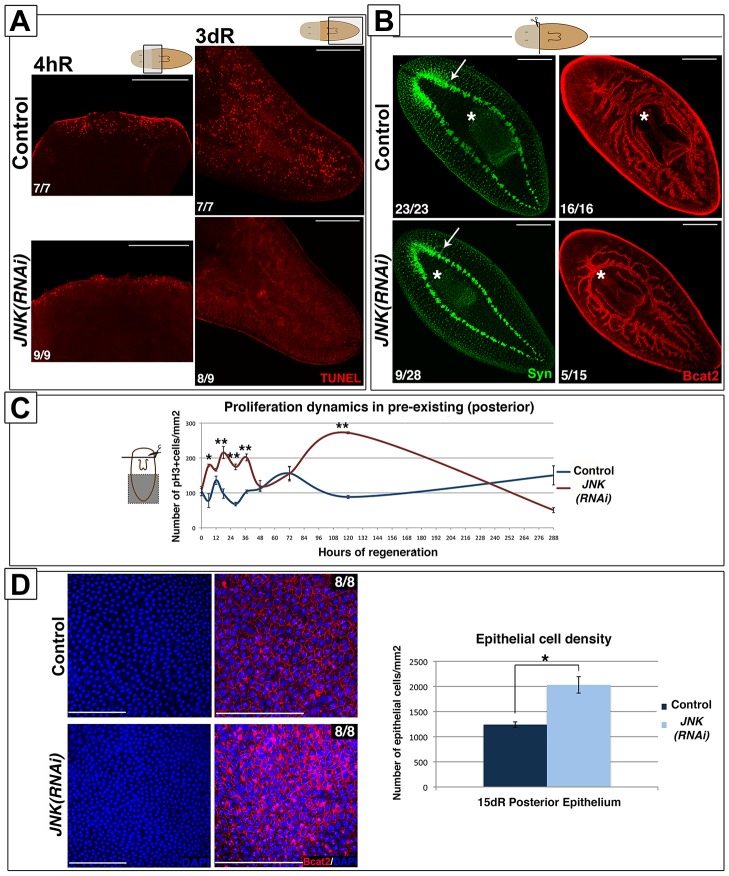
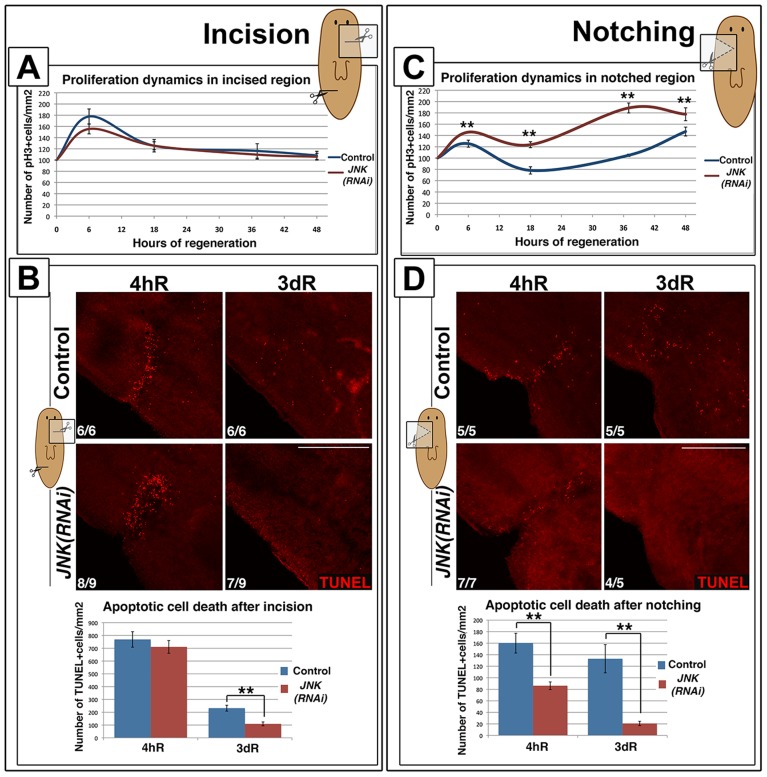
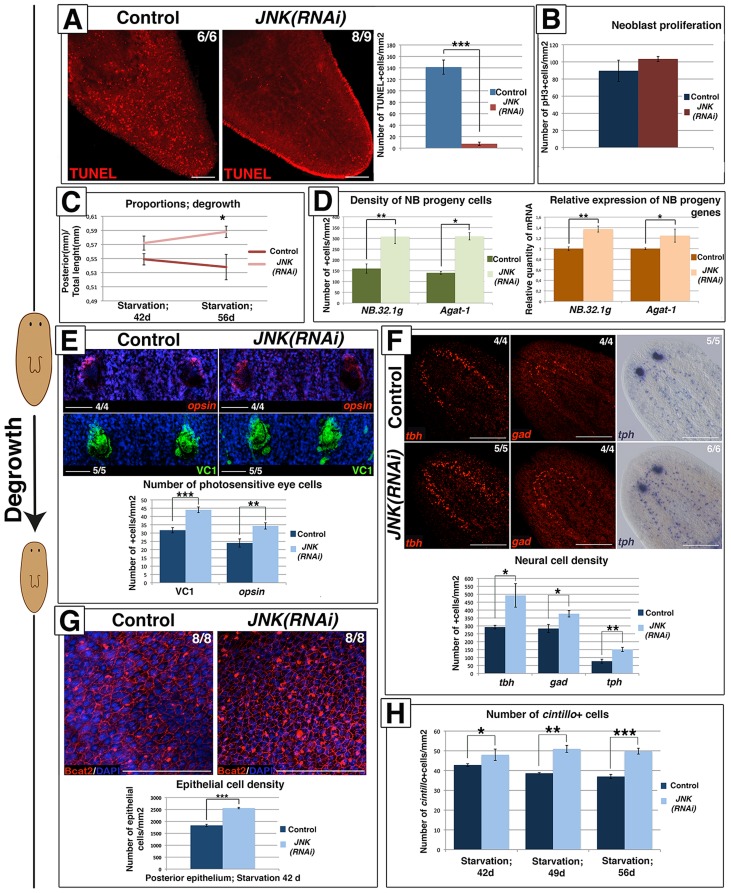
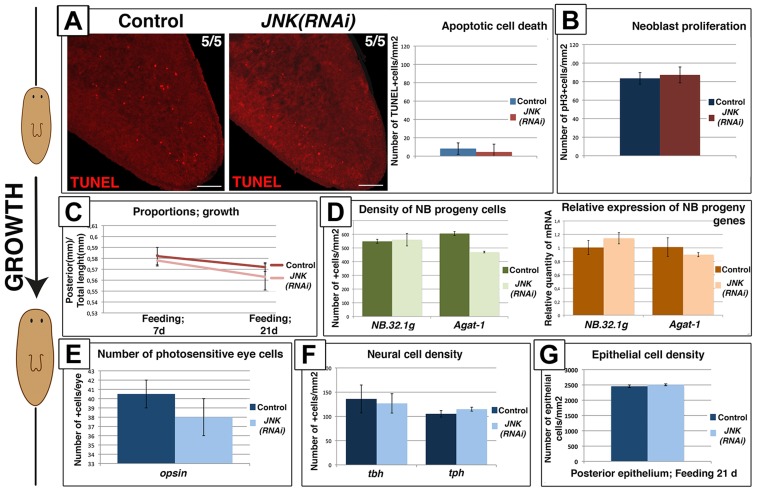
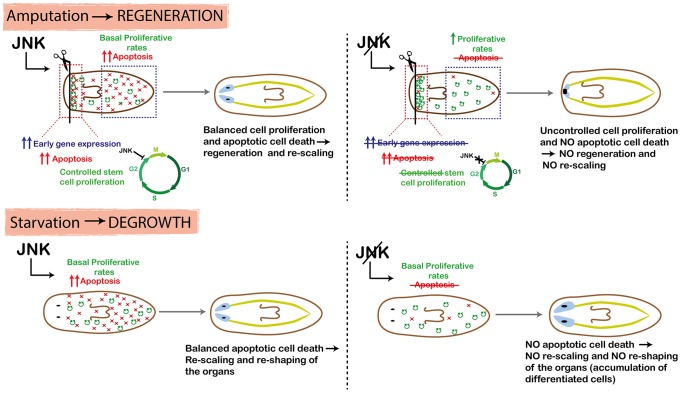
Regeneration of lost tissues depends on the precise interpretation of molecular signals that control and coordinate the onset of proliferation, cellular differentiation and cell death. However, the nature of those molecular signals and the mechanisms that integrate the cellular responses remain largely unknown. The planarian flatworm is a unique model in which regeneration and tissue renewal can be comprehensively studied in vivo. The presence of a population of adult pluripotent stem cells combined with the ability to decode signaling after wounding enable planarians to regenerate a complete, correctly proportioned animal within a few days after any kind of amputation, and to adapt their size to nutritional changes without compromising functionality. Here, we demonstrate that the stress-activated c-jun-NH2-kinase (JNK) links wound-induced apoptosis to the stem cell response during planarian regeneration. We show that JNK modulates the expression of wound-related genes, triggers apoptosis and attenuates the onset of mitosis in stem cells specifically after tissue loss. Furthermore, in pre-existing body regions, JNK activity is required to establish a positive balance between cell death and stem cell proliferation to enable tissue renewal, remodeling and the maintenance of proportionality. During homeostatic degrowth, JNK RNAi blocks apoptosis, resulting in impaired organ remodeling and rescaling. Our findings indicate that JNK-dependent apoptotic cell death is crucial to coordinate tissue renewal and remodeling required to regenerate and to maintain a correctly proportioned animal. Hence, JNK might act as a hub, translating wound signals into apoptotic cell death, controlled stem cell proliferation and differentiation, all of which are required to coordinate regeneration and tissue renewal.


Conflict of interest statement

The authors have declared that no competing interests exist.

Figures

Figure 1
Figure 1. JNK is required for anterior and posterior regeneration.
(A) Immunostaining with anti-synapsin (Syn) and anti-β-catenin-2 (Bcat2), which allow the visualization of the central nervous and digestive systems, respectively, in regenerating trunk and head fragments 15 days after anterior amputation. (Top left, anterior). (B) Expression analysis by WISH of the brain branches (gpas+), the anterior chemoreceptors (cintillo+) and FISH analysis of the expression of eye/eye progenitor cells (ovo+). The visual system was visualized by immunostaining with anti-VC1(VC-1). (Top, anterior). The number of representative samples with respect to the total is indicated in each image Syn, BCat2 and VC1 images correspond to confocal z-projections. Scale bars: 300 µm (A), 200 µm (B). dR, days of regeneration.
Figure 2
Figure 2. JNK modulates early wound-induced gene expression.
FISH analysis of egrl1 and runt1 expression in trunk fragments in response to wounding (after anterior amputation) and quantification of egrl1 and runt1 expression. At least five biological replicates were used. (Top, anterior). Error bars represent the standard error of the mean. Scale bars: 200 µm. hR, hours of regeneration.
Figure 3
Figure 3. JNK attenuates the cell cycle progression of planarian neoblasts.
(A) Double FISH analysis showing JNK and h2b expression in anterior region of intact animals. White arrowheads point to the sole expression of JNK in the brain. White boxes point to the region corresponding to the magnifications showed bellow where JNK are h2b are coexpressed in neoblast cells between the gut branches. (B) Graph depicting the quantity of mitotic cells (pH3+) in the wound region during anterior regeneration. At least nine biological replicates were used per time point. (C) Triple labeling of CldU+, piwi1+ and pH3+ cells in the wound region 6 hours after anterior amputation. To note all the pH3+(white) cells were also CldU+(red). Quantifications of the number of these single CldU+, double CldU+/piwi1+ and triple CldU+/piwi1+/pH3+ cells are shown. At least nine biological replicates were used. All images correspond to confocal z-projections. (Top left, anterior). Error bars represent the standard error of the mean. Data were analyzed by Student's t-test. *P<0.05; **P<0.01; ***P<0.001; differences are considered significant at P<0.05. Scale bars: 100 µm (B), 50 µm (C). hR, hours of regeneration; dR, days of regeneration.
Figure 4
Figure 4. JNK triggers apoptosis and restores proportionality after amputation.
(A) Whole-mount TUNEL staining showing apoptotic cells in the wound region (4 hR) and in pre-existing regions (3 dR) after anterior amputation. (Top/top left, anterior). (B) Immunostaining with anti-synapsin (Syn) and anti-β-catenin-2 (Bcat2) antibodies in regenerating trunk fragments 15 days after anterior amputation. These animals are the same as those used in the experiment depicted in Figure 1A. The white asterisk and arrow indicate the pharynx and the distal-most part of the brain, respectively. (Top left, anterior). (C) Graph showing the quantity of mitotic cells (pH3+) in pre-existing (posterior) regions after anterior regeneration. At least nine biological replicates were used per time point. (D) DAPI and BCat-2 staining of the epithelia (Top left, anterior) and quantification of the number of epithelial cells/mm2 in these post-pharyngeal (pre-existing) regions in regenerating trunks 15 days after amputation. Eight biological replicates were used per time point. All images correspond to confocal z-projections. Error bars represent standard error of the mean. Data were analyzed by Student's t-test. *P<0.05; **P<0.01; differences are considered significant at P<0.05. Scale bars: 200 µm (A), 300 µm (B), 50 µm (D). hR, hours of regeneration; dR, days of regeneration.
Figure 5
Figure 5. JNK is specifically required for de novo tissue regeneration.
(A) Graph showing proliferation dynamics after a lateral incision without loss of tissue. At least four biological replicates (2 incisions per organism) were used per time point. (B) Whole-mount TUNEL staining showing apoptotic cell death responses and graph depicting the quantification of TUNEL-positive cells after a simple incision. At least six biological replicates (2 incisions per organism) were used per time point. (C) Graph showing proliferation dynamics after a small lateral amputation with loss of tissue. At least four biological replicates were used per time point for quantification. (D) Whole-mount TUNEL staining showing apoptotic cell death responses and graph depicting the quantification of TUNEL-positive cells after a small lateral amputation. At least five biological replicates were used per time point. (Top left, anterior). TUNEL images correspond to confocal z-projections. The area analyzed for quantification of TUNEL+ cells density was more restricted to the wound region for incisions than for notchings. Error bars represent the standard error of the mean. Data were analyzed using a Student's t-test. **P<0.01; differences are considered significant at P<0.05. Scale bars: 200 µm. hR, hours of regeneration; dR, days of regeneration.
Figure 6
Figure 6. JNK-dependent apoptosis is required for proper remodeling during degrowth.
(A) Whole-mount TUNEL staining showing apoptotic cell death during degrowth in post-pharyngeal regions and graph showing quantification of cells dying by apoptosis (TUNEL-positive) in animals starved for 42 days. At least six biological replicates were used. (B) Graph showing quantification of mitotic (pH3+) cells in animals starved for 42 days. At least nine biological replicates were used. (C) Graph showing the size of the post-pharyngeal region (from pharynx anchoring to tail tip) relative to the whole-body length during degrowth. Values represent the means of 15 biological replicates. (D) Quantification of NB.32.1g and Agat-1 expression in starved animals. The green histograms depict the quantification of cells positive for these two markers after FISH. At least four biological replicates were used. The orange histograms depict the relative expression of the two markers as determined by qRT-PCR. Values represent the means of three biological replicates. (E). FISH analysis of photoreceptor cells (opsin+), immunostaining of the visual system (VC1+) with DAPI counterstaining and graph showing the quantification of the number of photoreceptor cells/eye in animals starved for 42 days. Four biological replicates (8 eyes) were used. (F) FISH analysis of GABAergic (gad+) and octopaminergic (tbh+) neurons, WISH analysis of serotoninergic (tph+) neurons and graph showing the quantification of the number of neural cells/mm2 in the brains of animals starved for 42 days. (G) Staining of the epithelia with DAPI and anti-β-catenin-2 antibody (Bcat2), and graph showing the quantification of the number of epithelial cells/mm2 in post-pharyngeal regions of animals starved for 42 days. Eight biological replicates were used. (H) Quantification of the number of cintillo+ cells in the anterior region during the starvation process. At least five biological replicates were used. (Top left, anterior). All images, except for the tph image, correspond to confocal z-projections. Error bars represent standard error of the mean. Data were analyzed by Student's t-test. *P<0.05; **P<0.01; ***P<0.001; differences are considered significant at P<0.05. Scale bars: 100 µm (A), 50 µm (E), 300 µm (F), 50 µm (G). d, days of starvation.
Figure 7
Figure 7. Remodeling during growth does not depend on JNK-dependent apoptotic cell death.
(A) Whole-mount TUNEL staining showing apoptotic cell death during growth in post-pharyngeal regions and graph showing the quantification of cells dying by apoptosis (TUNEL+) in animals fed for 7 days. At least five biological replicates were used. (B) Graph showing quantification of mitotic cells (pH3+) in animals fed for 7 days. At least 10 biological replicates were used. (C) Graph showing the size of the post-pharyngeal area (from the pharynx anchoring to tail tip) relative to whole-body length during growth. Values represent the means of 15 biological replicates. (D) Quantification of NB.32.1g and Agat-1 expression. Green histograms depict the quantification of cells positive for these two markers after FISH. At least four biological replicates were used. Orange histograms depict the relative expression levels of the two markers as determined by qRT-PCR. Values represent means of three biological replicates. (E) Quantification of the number of photoreceptor cells (opsin+)/eye of animals fed for 21 days. Three biological replicates (6 eyes) were used. (F) Quantification of the number of neural cells/mm2 in the brains of animals fed for 21 days. At least four biological replicates were used (G) Quantification of the number of epithelial cells/mm2 in post-pharyngeal regions of animals fed for 21 days. Six biological replicates were used. (Top left, anterior). All images correspond to confocal z-projections. Error bars represent standard error of the mean. Data were analyzed by Student's t-test. Differences are considered significant at P<0.05. Scale bar: 100 µm. d, days of feeding.
Figure 8
Figure 8. Schematic showing role of JNK in planarian regeneration and homeostatic degrowth.
In the wound region, JNK triggers early-gene expression and apoptosis, and mediates temporal control of the cell cycle progression of neoblasts, which ensures the balanced differentiation of different cell types and hence proper regeneration of missing tissues. In pre-existing regions, JNK triggers apoptosis and maintains basal levels of proliferation to ensure that body proportion is properly restored after amputation. RNA interference of JNK activity prevents all these processes in both the wound region and in pre-existing regions, as well as regeneration and rescaling.

References

    1. Newmark PA, Sánchez Alvarado A (2002) Not your father's planarian: a classic model enters the era of functional genomics. Nat Rev Genet 3: 210–219. - PubMed
    1. Reddien PW, Sánchez Alvarado A (2004) Fundamentals of planarian regeneration. Annu Rev Cell Dev Biol 20: 725–757. - PubMed
    1. Saló E (2006) The power of regeneration and the stem-cell kingdom: freshwater planarians (Platyhelminthes). Bioessays 28: 546–559. - PubMed
    1. Handberg-Thorsager M, Fernandez E, Saló E (2008) Stem cells and regeneration in planarians. Front Biosci 13: 6374–6394. - PubMed
    1. Tanaka EM, Reddien PW (2011) The cellular basis for animal regeneration. Dev Cell 21: 172–185. - PMC - PubMed

Publication types

Substances