

Traffic fatality reductions: United States compared with 25 other countries
- PMID: 24922136
- PMCID: PMC4103211
- DOI: 10.2105/AJPH.2014.301922
Traffic fatality reductions: United States compared with 25 other countries
Abstract
Objectives: I compared US traffic fatality trends with those in 25 other countries.
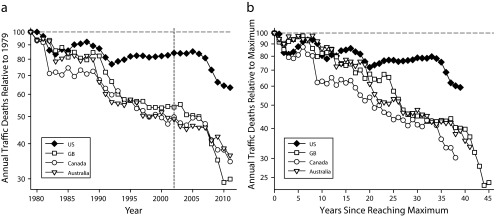
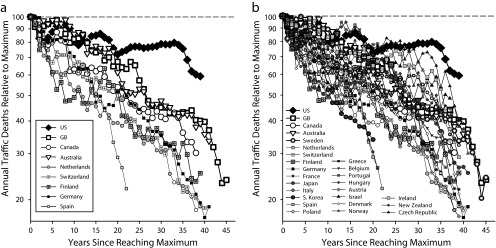
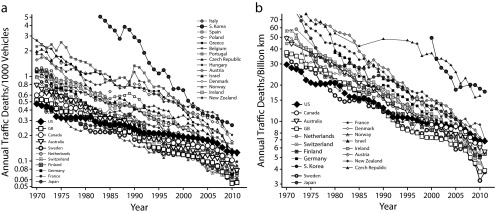
Methods: I have introduced a new measure for comparing safety in different countries: traffic deaths in a specific year relative to largest annual number recorded. I used only data from the International Road Traffic Accident Database.
Results: The United States is a unique outlier. Fatalities in all 25 other countries declined further after reaching their maximum values. For example, the United States and the Netherlands both reached maximum values in 1972. From 1972 to 2011 US deaths declined by 41%, whereas those in the Netherlands declined by 81%. If US fatalities had declined by 81% there would have been 22 000 fewer US road deaths in 2011. If the United States matched percentage declines of 6 additional countries, US deaths would have declined by more than 20 000.
Conclusions: If US traffic deaths had declined by the same percentage as in any 1 of 7 other countries, more than 20 000 fewer Americans would have been killed in 2011.
Figures
Comment in
-
Twenty thousand more Americans killed annually because US traffic-safety policy rejects science.Am J Public Health. 2014 Aug;104(8):1349-51. doi: 10.2105/AJPH.2014.301919. Epub 2014 Jun 12. Am J Public Health. 2014. PMID: 24922140 Free PMC article. No abstract available.
-
Science and public health principles used to reduce road deaths.Am J Public Health. 2014 Dec;104(12):2256-8. doi: 10.2105/AJPH.2014.302352. Epub 2014 Oct 16. Am J Public Health. 2014. PMID: 25320900 Free PMC article.
References
-
- Evans L. Traffic Safety. Bloomfield Hills, MI: Science Serving Society; 2004.
-
- National Highway Traffic Safety Administration. Fatality Analysis Reporting System. Available at: http://www-fars.nhtsa.dot.gov/Main/index.aspx. Accessed January 31, 2014.
-
- Weiss HB, Songer TJ, Fabio A. Fetal deaths related to maternal injury. JAMA. 2001;286(15):1863–1868. - PubMed
-
- Wolf ME, Alexander B, Rivara F et al. Retrospective cohort study of seatbelt use and pregnancy outcome after a motor vehicle crash. J Trauma. 1993;34(1):116–119. - PubMed
Publication types
MeSH terms
LinkOut - more resources
Full Text Sources
Other Literature Sources
