. 2014 Jun 11;15(6):741-52.
doi: 10.1016/j.chom.2014.05.007.

Cell-to-cell transfer of M. tuberculosis antigens optimizes CD4 T cell priming

Affiliations

Cell-to-cell transfer of M. tuberculosis antigens optimizes CD4 T cell priming

Smita Srivastava et al. Cell Host Microbe. .

Abstract

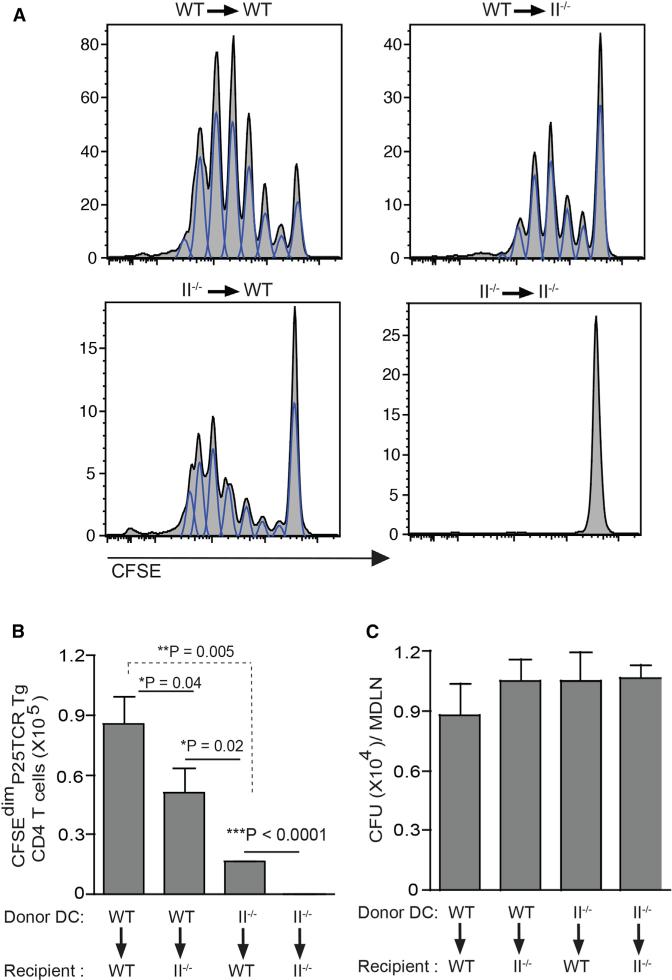
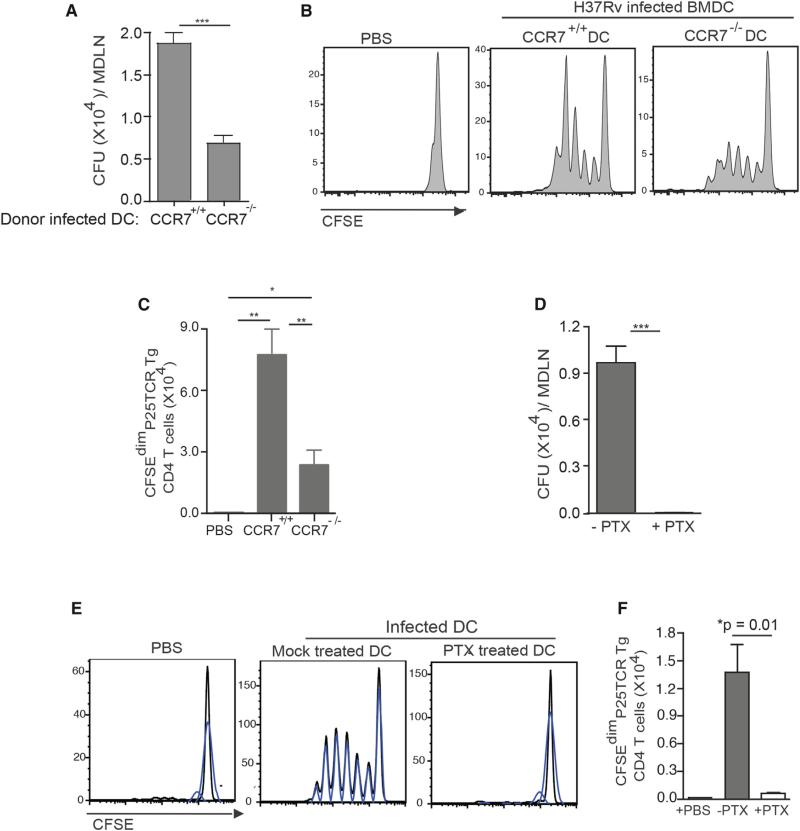
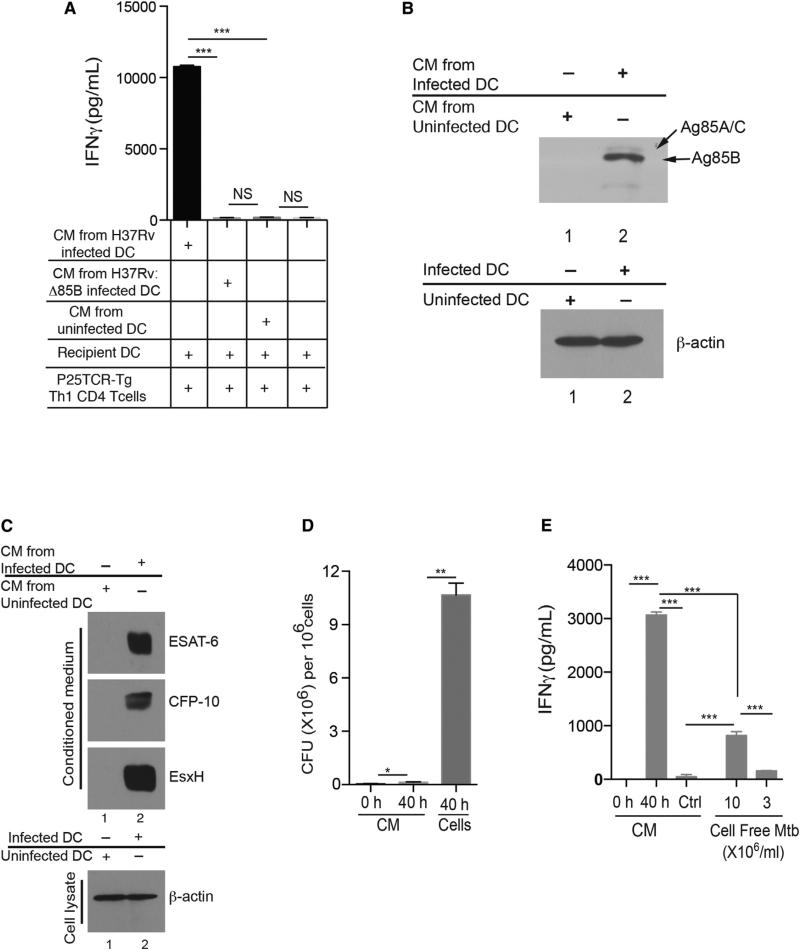
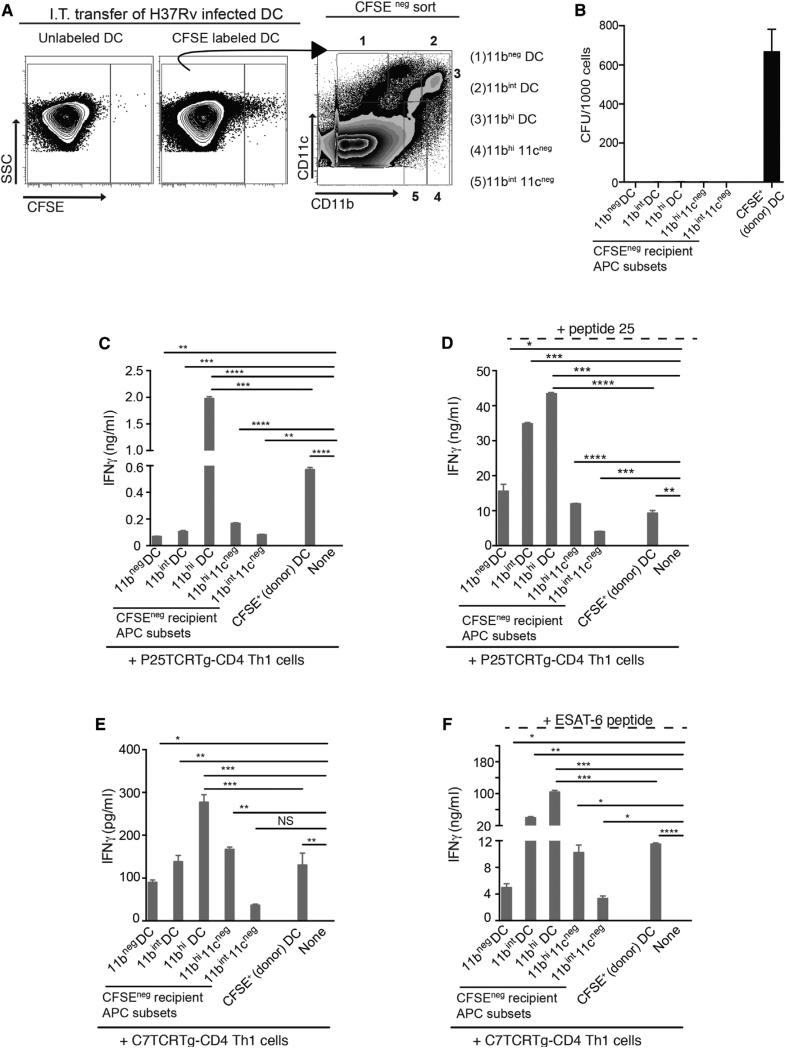
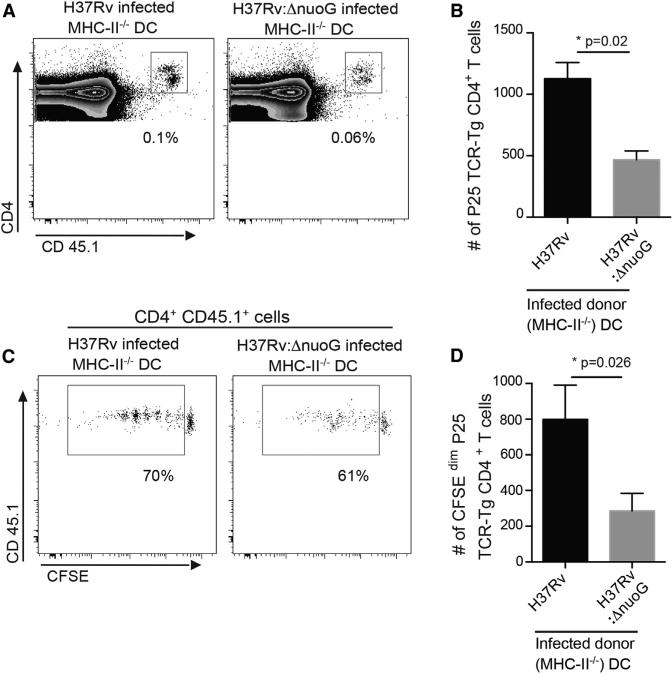
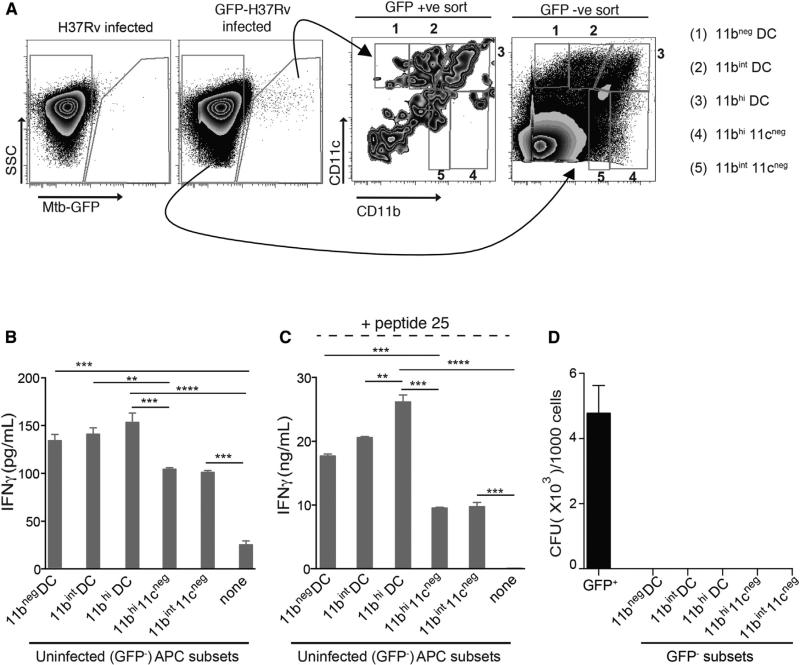
During Mycobacterium tuberculosis and other respiratory infections, optimal T cell activation requires pathogen transport from the lung to a local draining lymph node (LN). However, the infected inflammatory monocyte-derived dendritic cells (DCs) that transport M. tuberculosis to the local lymph node are relatively inefficient at activating CD4 T cells, possibly due to bacterial inhibition of antigen presentation. We found that infected migratory DCs release M. tuberculosis antigens as soluble, unprocessed proteins for uptake and presentation by uninfected resident lymph node DCs. This transfer of bacterial proteins from migratory to local DCs results in optimal priming of antigen-specific CD4 T cells, which are essential in controlling tuberculosis. Additionally, this mechanism does not involve transfer of the whole bacterium and is distinct from apoptosis or exosome shedding. These findings reveal a mechanism that bypasses pathogen inhibition of antigen presentation by infected cells and generates CD4 T cell responses that control the infection.


Figures

Figure 1
Figure 1. Migratory and Lymph Node Resident DCs Collaborate for Optimal Activation of Naive Antigen-Specific CD4 T Cells in Tuberculosis
(A–C) Wild-type C57BL/6 or MHC-II−/− mice received CFSE-labeled naive Ag85B-specific P25TCR-Tg CD4+ T cells followed by intratracheal transfer of M. tuberculosis-infected wild-type or MHC-II−/− DCs (moi 1:1; 1 × 10⁶ bacteria/1 × 106 DCs/ mouse). (A) Proliferation of CFSE-labeled P25TCR-Tg CD4+ T cells in mediastinal lymph nodes (MDLNs) of wild-type or MHC-II−/− mice 60 hr after intratracheal transfer of M. tuberculosis-infected wild-type or MHC-II−/− DCs. Flow cytometry plots represent a pool of cells from MDLN of two mice (three pools from six mice per group). (B) Quantitation of P25TCR-Tg CD4+ T cells that have undergone at least one cycle of proliferation (CFSEdim) in MDLN of the groups of mice shown in (A). (C) Quantitation of bacteria in MDLN of the groups of mice shown in (A) and (B). Data are expressed as mean ± SEM of three pools of mice (n = 6) per experimental group and represent three independent experiments. *p < 0.05; **p < 0.01; ***p < 0.001. See also Figure S1.
Figure 2
Figure 2. DC Migration Is Required for Transport of M. tuberculosis from the Lungs to the MDLN and Priming of Ag85B-Specific CD4 T Cells
(A) Quantitation of bacteria in the MDLNs of wild-type mice 60 hr after intratracheal transfer of M. tuberculosis-infected wild-type or CCR7−/− DCs (moi 0.6:1; 6 × 10⁵ bacteria/1 × 106 DC/mouse). (B) Proliferation profile of CFSE-labeled P25TCR-Tg CD4+ T cells in MDLNs of the groups of mice shown in (A). Control mice received PBS. (C) Quantitation of P25TCR-Tg CD4+ T cells that have undergone at least one cycle of proliferation (CFSEdim) in MDLNs of groups of mice shown in (A) and (B). (D) Quantitation of bacteria in wild-type mice 60 hr after intratracheal transfer of infected wild-type DCs (moi 0.5:1; 5 × 10⁵ bacteria/1 × 106 DC/mouse) that were either mock treated or treated with pertussis toxin (PTX). (E) Proliferation profile of CFSE-labeled P25TCR-Tg CD4+ T cells in MDLN of the groups of mice shown in (C) and (D). Control mice received PBS. Each CFSE histogram represents a pool of cells from two mice (three pools from a total of six mice per group). (F) Quantitation of P25TCR-Tg CD4+ T cells that have undergone at least one cycle of proliferation (CFSEdim) in MDLNs of groups of mice in (D) and (E). Data are expressed as mean ± SEM of either individual mice (n = 4–5; A–C) or three pools of mice (n = 6; D–F) per experimental group and represent two independent experiments. *p < 0.05; **p < 0.01; ***p < 0.001. See also Figure S2.
Figure 3
Figure 3. M. tuberculosis-Infected DCs Release Ag85B for Uptake and Presentation by Uninfected DCs to CD4 T Cells
(A–E) Conditioned medium (CM) was collected 40 hr after infection of DCs with M. tuberculosis (moi = 2), sterile filtered, and added to uninfected DCs along with Th1-polarized P25TCR-Tg cells. Sixty hours later, IFNg was quantitated in supernatants. (A) Antigen-dependent IFNg secretion by P25TCR-Tg CD4+ Th1 T cells cultured with conditioned medium collected from uninfected DCs or DCs infected with either wild-type M. tuberculosis (H37Rv) or Ag85B null M. tuberculosis (H37Rv:Δ85B). (B) Immunoblot of Ag85B in conditioned medium from M. tuberculosis-infected DCs (lane 2) or uninfected DCs (lane 1). (C) Immunoblot showing presence of ESAT-6, CFP-10, and EsxH in conditioned medium (CM) collected from infected DCs (moi 2) (lane 2) and uninfected DCs (lane 1) after 40 hr. The infected DCs and uninfected DCs used to generate CM were lysed and probed for actin expression. (D) Quantitation of bacteria in: CM from M. tuberculosis-infected DCs at time = 0 (CM = 0 hr); CM from infected DCs after 40 hr of culture (CM = 40 hr); or in lysates of DCs infected and cultured for 40 hr (cells = 40 hr). (E) IFNg secretion by P25 TCR-Tg Th1 CD4+ T cells when cocultured with uninfected DCs in the presence of: CM collected immediately after addition of fresh medium to M. tuberculosis-infected BMDCs (0 hr); CM collected after 40 hr (40 hr); media from bacteria cultured without cells at 3 × 10⁶/ml or 10 × 106/ml in BMDC media. Data are expressed as mean ± SEM of three replicates and represent 3–4 independent experiments. *p < 0.05; **p < 0.01; ***p < 0.001. See also Figure S3.
Figure 4
Figure 4. Infected BMDCs Transfer Antigen to Recipient Lymph Node Mononuclear Cells In Vivo
(A–F) Naive wild-type mice received M. tuberculosis-infected, CFSE-labeled BMDCs intratracheally; 48 hr later MDLNs were harvested from 9 mice, pooled, stained with antibodies to CD11c, CD11b, and Gr-1, and sorted by FACS into subsets that were used to stimulate P25TCR-Tg Th1 CD4 cells. Responses were quantitated as IFNg secretion. (A) Flow cytometry plots and sorting strategy for CFSE+, M. tuberculosis-infected (donor) BMDCs, and CFSE (recipient) MDLN cells after gating out Gr-1hiCD11bhi neutrophils. Cells from mice that received unlabeled infected BMDCs were used to set CFSE+ and CFSE gates. (B) Quantitation of bacteria in FACS-sorted MDLN cell subsets used to stimulate CD4 T cells in (C)–(F). Sorted cells were serially diluted and plated in triplicate, and colonies were counted 21 days later. (C) IFNg secretion by P25TCR-Tg Th1 CD4 cells (1 APC: 15 T cells) after 4 days of stimulation by sorted CFSE subsets or by infected CFSE+ BMDC. (D) Same cells and conditions as in (C), with the addition of Ag85B peptide 25 (1 μg/ml). (E) IFNg secretion by ESAT-63-15-specific C7TCRTg Th1 CD4 cells (1 APC: 15 T cells) after 4 days of stimulation by sorted CFSE subsets or by infected CFSE+ BMDCs. (F) Same cells and conditions as in (E), with the addition of ESAT-63-15 peptide (1 μg/ml). Data are expressed as mean ± SEM of replicates and represent two independent experiments. *p < 0.05; **p < 0.01; ***p < 0.001.
Figure 5
Figure 5. Increasing Apoptosis of Migratory DCs Does Not Enhance Antigen-Specific CD4 T Cell Proliferation In Vivo
(A) Representative FACS plots showing the frequency of adoptively transferred P25TCR-Tg CD4+ T cells in the MDLN of wild-type C57BL/6 mice, 60 hr after intratracheal transfer of MHCII−/− DCs infected with H37Rv or H37Rv:DnuoG (moi 0.5:1; 5 × 10⁵ bacteria/1 × 106 DC/mouse). (B) Quantitation of total P25TCR-Tg CD4+ T cells in the MDLNs of the groups of mice shown in (A). (C) Proliferation profile of CFSE-labeled P25TCRTg CD4+ T cells in the MDLNs of groups of mice shown in (A) and (B). (D) Quantitation of P25TCR-Tg CD4+ T cells that have undergone at least one cycle of proliferation (CFSEdim) in MDLNs of groups of mice shown in (A)–(C). Data are mean ± SEM of three pools of mice (n = 6) per experimental group and represent two independent experiments. *p < 0.05; **p < 0.01; ***p < 0.001. See also Figure S4.
Figure 6
Figure 6. Transfer of Ag85B without Pathogen Transfer to Resident Antigen-Presenting Cells in the MDLN after Aerosol Infection
(A–D) MDLNs were harvested and pooled from 9–10 mice 15 days post-aerosol infection with GFP-expressing H37Rv (~200 cfu/mouse). Lymph node cells were stained with CD11c, CD11b, and Gr-1-specific antibodies, sorted by FACS, and subsequently used to stimulate P25TCR-Tg Th1 CD4 cells. (A) FACS plot and sorting strategy for GFP-positive (infected) and GFP-negative (uninfected) MDLN cells based on CD11c/CD11b-defined subsets after neutrophils (Gr-1hiCD11bhi) were gated out. (B) IFNg secretion by P25TCR-Tg Th1 CD4 cells (1 APC: 15 T cells) after stimulation by GFP-negative (uninfected) sorted CD11c/ CD11b-defined cell subsets. (C) Same cells and conditions as in (B), with the addition of Ag85B peptide 25 (1 μg/ml). (D) Quantitation of bacteria in MDLN cell subsets used to stimulate CD4 T cells in (B) and (C). Sorted cells were serially diluted and plated in triplicate or quadruplicate; colonies were counted 21 days after plating. Data are expressed as mean ± SEM of replicates. A similar experiment yielded comparable results. *p < 0.05; **p < 0.01; ***p < 0.001. See also Figure S5.

Comment in

  • Antigen smuggling in tuberculosis.
    Hudrisier D, Neyrolles O. Hudrisier D, et al. Cell Host Microbe. 2014 Jun 11;15(6):657-9. doi: 10.1016/j.chom.2014.05.018. Cell Host Microbe. 2014. PMID: 24922567

References

    1. Albert ML, Sauter B, Bhardwaj N. Dendritic cells acquire antigen from apoptotic cells and induce class I-restricted CTLs. Nature. 1998;392:86–89. - PubMed
    1. Allan RS, Smith CM, Belz GT, van Lint AL, Wakim LM, Heath WR, Carbone FR. Epidermal viral immunity induced by CD8alpha+ dendritic cells but not by Langerhans cells. Science. 2003;301:1925–1928. - PubMed
    1. Allan RS, Waithman J, Bedoui S, Jones CM, Villadangos JA, Zhan Y, Lew AM, Shortman K, Heath WR, Carbone FR. Migratory dendritic cells transfer antigen to a lymph node-resident dendritic cell population for efficient CTL priming. Immunity. 2006;25:153–162. - PubMed
    1. Baena A, Porcelli SA. Evasion and subversion of antigen presentation by Mycobacterium tuberculosis. Tissue Antigens. 2009;74:189–204. - PMC - PubMed
    1. Ballesteros-Tato A, León B, Lund FE, Randall TD. Temporal changes in dendritic cell subsets, cross-priming and costimulation via CD70 control CD8(+) T cell responses to influenza. Nat. Immunol. 2010;11:216–224. - PMC - PubMed

Publication types

MeSH terms

Substances