. 2014 Jun 10;3(3):e000670.
doi: 10.1161/JAHA.113.000670.

Cardiac CD47 drives left ventricular heart failure through Ca2+-CaMKII-regulated induction of HDAC3

Affiliations

Cardiac CD47 drives left ventricular heart failure through Ca2+-CaMKII-regulated induction of HDAC3

Maryam Sharifi-Sanjani et al. J Am Heart Assoc. .

Abstract

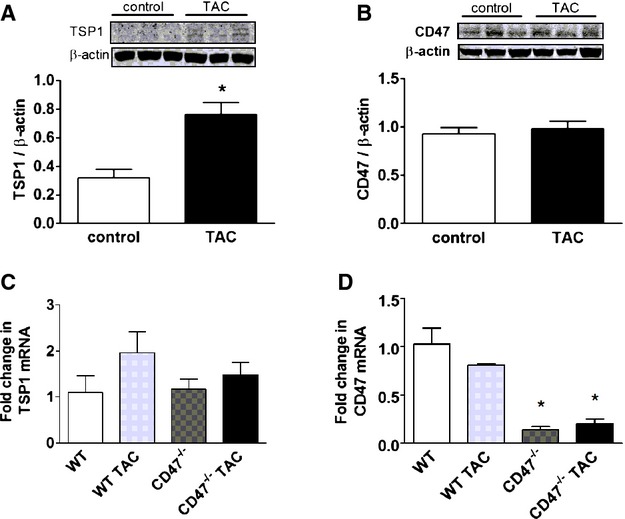
Background: Left ventricular heart failure (LVHF) remains progressive and fatal and is a formidable health problem because ever-larger numbers of people are diagnosed with this disease. Therapeutics, while relieving symptoms and extending life in some cases, cannot resolve this process and transplant remains the option of last resort for many. Our team has described a widely expressed cell surface receptor (CD47) that is activated by its high-affinity secreted ligand, thrombospondin 1 (TSP1), in acute injury and chronic disease; however, a role for activated CD47 in LVHF has not previously been proposed.

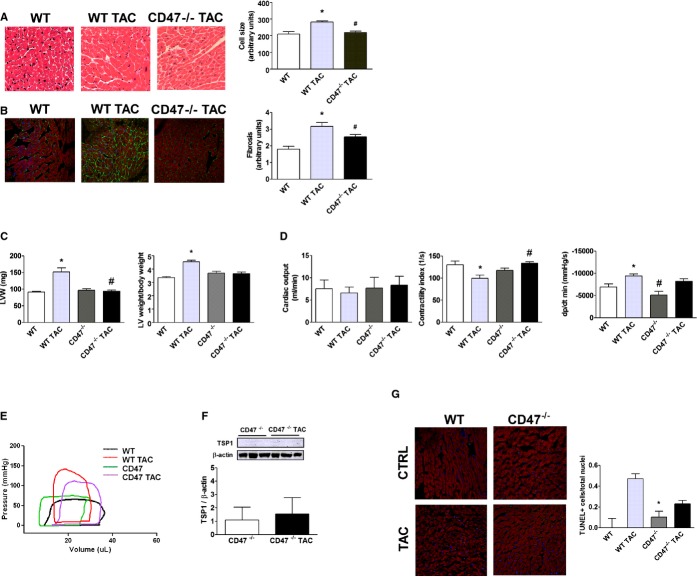
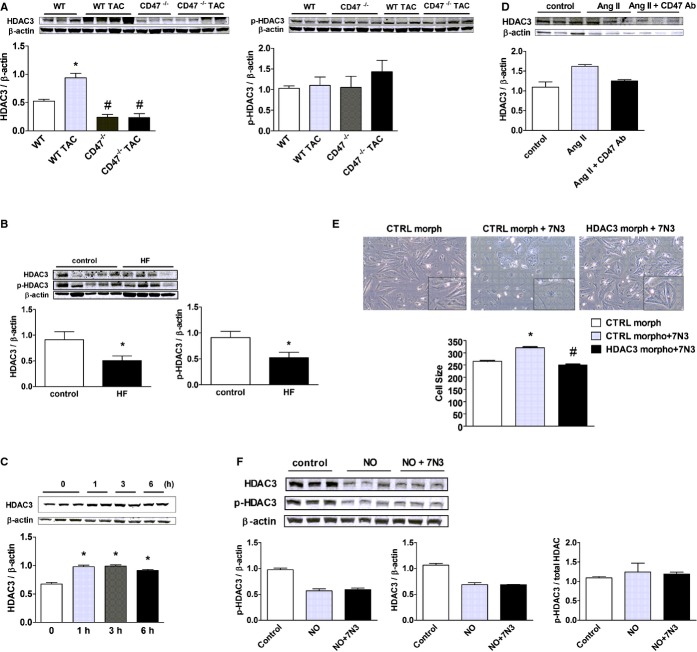
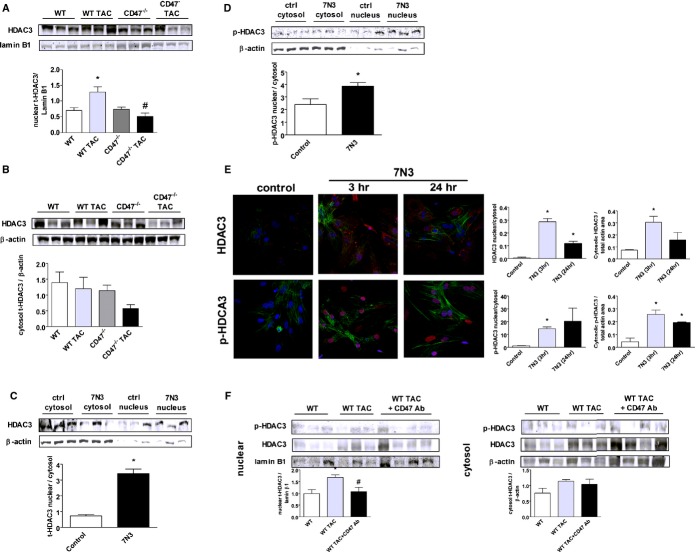
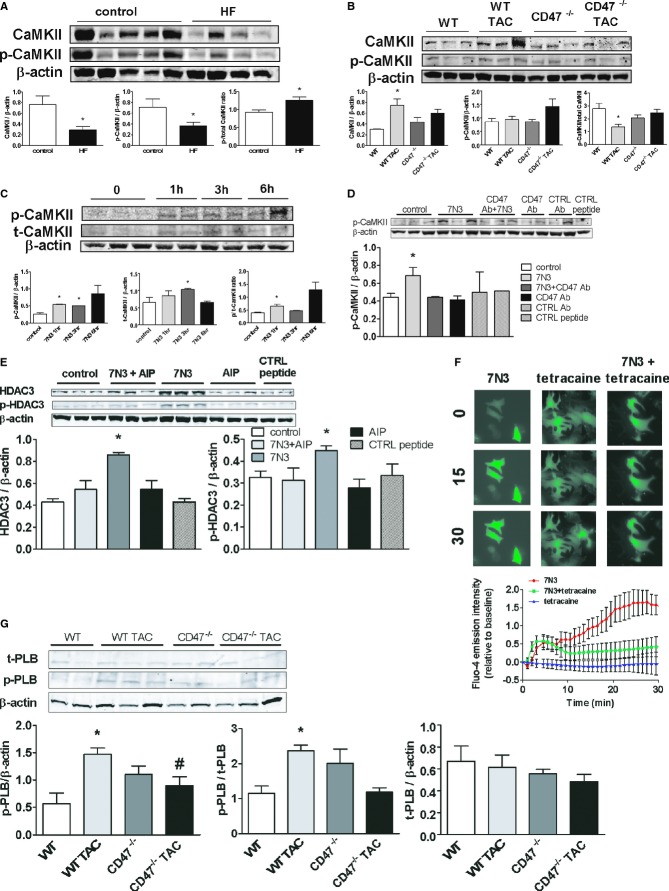
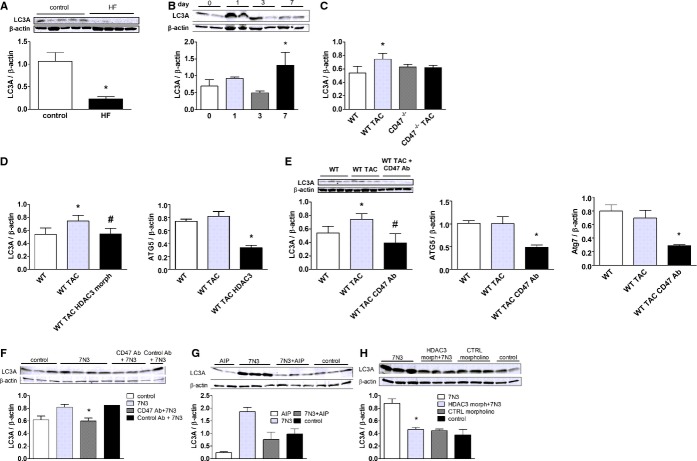
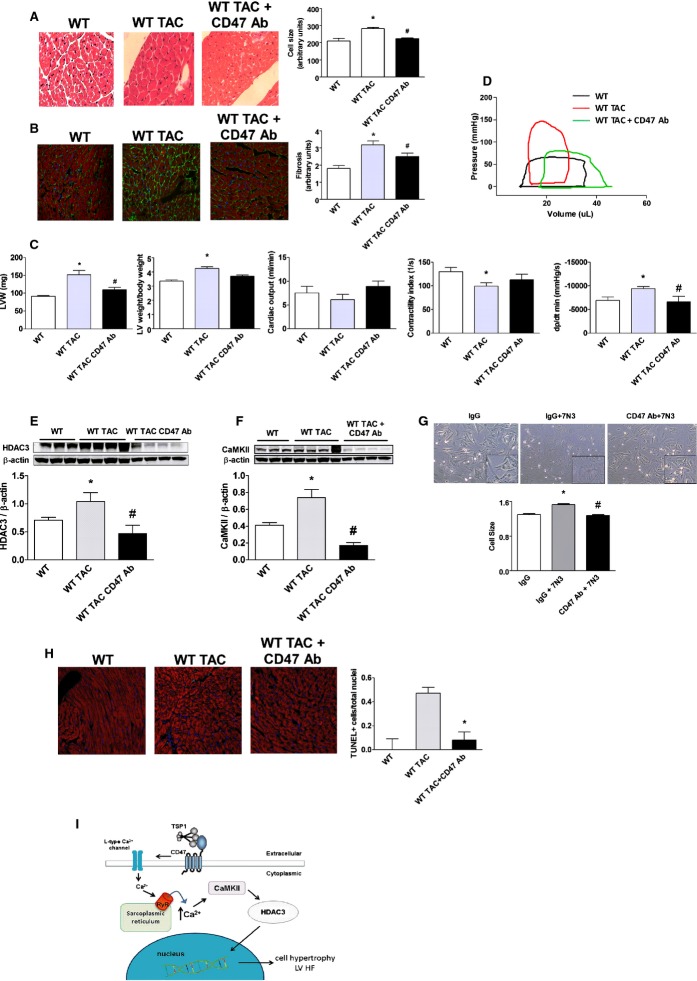
Methods and results: In experimental LVHF TSP1-CD47 signaling is increased concurrent with up-regulation of cardiac histone deacetylase 3 (HDAC3). Mice mutated to lack CD47 displayed protection from transverse aortic constriction (TAC)-driven LVHF with enhanced cardiac function, decreased cellular hypertrophy and fibrosis, decreased maladaptive autophagy, and decreased expression of HDAC3. In cell culture, treatment of cardiac myocyte CD47 with a TSP1-derived peptide, which binds and activates CD47, increased HDAC3 expression and myocyte hypertrophy in a Ca(2+)/calmodulin protein kinase II (CaMKII)-dependent manner. Conversely, antibody blocking of CD47 activation, or pharmacologic inhibition of CaMKII, suppressed HDAC3 expression, decreased myocyte hypertrophy, and mitigated established LVHF. Downstream gene suppression of HDAC3 mimicked the protective effects of CD47 blockade and decreased hypertrophy in myocytes and mitigated LVHF in animals.

Conclusions: These data identify a proximate role for the TSP1-CD47 axis in promoting LVHF by CaKMII-mediated up-regulation of HDAC3 and suggest novel therapeutic opportunities.

Keywords: CD47; CaKMII; HDAC3; calcium; heart failure; thrombospondin‐1.


Figures

Figure 1.
Figure 1.
TSP1‐CD47 signaling is up‐regulated in LVHF. Western immunoblot analysis of protein expression (A and B) and mRNA transcript (C and D) levels of TSP1 and CD47 left ventricle samples from wild‐type (WT) and CD47 (−/−) null mice pre‐ and 4 weeks post‐TAC. Data are presented as the mean (±SEM; n=3 to 7 animals/group). *=statistically significant difference (P<0.05), compared to control and WT and WT TAC. LVHF indicates left ventricular heart failure; TAC, transverse aortic constriction; TSP1, thrombospondin 1.
Figure 2.
Figure 2.
CD47 promotes LVHF. A, H&E staining of murine left ventricle tissue sections from wild‐type (WT) and CD47 (−/−) null mice 4 weeks post‐TAC and controls. Cell‐size quantification is presented as the mean (±SEM) of analysis of 4 to 5 slides per animal sample, 10 random hpf per slide, 4 to 5 animals per treatment group. *=statistically significant difference (P<0.05), compared to WT; #=statistically significant difference (P<0.05), compared to WT TAC. Representative images are presented (original magnification, ×40). B, Immunofluorescence staining of murine left ventricle tissue sections 4 weeks post‐TAC or control. DAPI, collagen I, and phalloidin colored blue, green, and red, respectively. Fibrosis is calculated as intensity of fluorescence and is presented as the mean (±SEM) of analysis of 3 to 5 slides per animal sample, 10 random hpf per slide, 4 to 7 animals per treatment group. *=statistically significant difference (P<0.05), compared to WT; #=statistically significant difference (P<0.05), compared to WT TAC. Representative images are presented (original magnification, ×40). C, Left ventricle weights (LVW) and LV to body weight from animals 4 weeks post‐TAC or controls. Data are presented as the mean (±SEM) of n=7 to 12 animals per group. *=statistically significant difference (P<0.05), compared to WT; #=statistically significant difference (P<0.05), compared to WT TAC. D, Assessment by open‐chest pressure volume loop analysis of cardiac output, contractility, and ventricular stiffness (dp/dt min) of animals 4 weeks post‐TAC or control. Data are presented as the mean (±SEM) of n=7 to 12 animals/group. *=statistically significant difference (P<0.05), compared to WT; #=statistically significant difference (P<0.05), compared to WT TAC. E, Representative pressure volume tracings are shown from age‐matched male WT and CD47‐null mice at baseline and post‐TAC. F, Western immunoblot analysis of TSP1 expression in left ventricular samples from CD47 null mice 4 weeks post‐TAC or control. Data are presented as the mean (±SEM; n=3 to 6 animals per group). G, TUNEL staining of murine left ventricle tissue sections from control WT and CD47‐null animals (CTRL) and 4 weeks post‐TAC. Data are presented as the mean (±SEM) of the ratio of TUNEL positive cells over total nuclei from analysis of 4 to 5 slides per animal sample, 10 random hpf per slide, 3 to 4 animals per treatment group. *=statistically significant difference (P<0.05), compared to WT TAC. DAPI indicates 4',6‐diamidino‐2‐phenylindole; H&E, hematoxylin and eosin; LVHF, left ventricular heart failure; TAC, transverse aortic constriction; TSP1, thrombospondin 1; TUNEL, terminal deoxynucleotidyl transferase dUTP nick end labeling.
Figure 3.
Figure 3.
CD47 up‐regulates HDAC 3 in LVHF. A, Western immunoblot analysis of HDAC3 and phosphorylated (p‐)HDAC3 expression in LV samples from wild‐type (WT) and CD47 (−/−) null animals 4 weeks post‐TAC or control. Densitometry is presented as the mean (±SEM) of n=6 to 9 animals per group. *=statistically significant difference (P<0.05), compared to WT; #=statistically significant difference (P<0.05), compared to WT TAC. B, Western immunoblot analysis of HDAC3 and phosphorylated HDAC3 (p‐HDAC3) expression in left ventricular samples from end‐stage nonischemic LVHF (n=4) and control (n=5) patients. Densitometry is presented as the mean (±SEM). *=statistically significant difference (P<0.05), compared to control. C, Rat neonatal cardiac myocytes (RNCMs) were treated with the TSP1‐based CD47‐activating peptide, 7N3 (10 μmol/L), for the indicated time points (h=hours) or (D) angiotensin II (Ang II; 10 μmol/L for 48 hours)±a CD47 antagonist antibody (Ab; clone OX101, 1 μg/mL) and Western immunoblot analysis of HDAC3 protein expression performed on cell lysates. Representative blots are shown. Densitometry is presented as the mean (±SEM) of n=3 experiments. *=statistically significant difference (P<0.05), compared to untreated. E, RNCMs were treated with a HDAC3 or control (CTRL) morpholino oligonucleotide (20 mmol/L)±peptide 7N3 (10 μmol/L) for 48 hours and cell size assessed. Representative images are presented (original magnification, ×40). Data are presented as the mean (±SEM) of 4 separate experiments. *=statistically significant difference (P<0.05), compared to CTRL morpholino; #=statistically significant difference (P<0.05), compared to CTRL morpholino+7N3. F, RNCMs were treated with the CD47‐activating peptide, 7N3 (10 μmol/L)±DETA‐NO (10 μmol/L), for 3 hours, and Western immunoblot analysis of total and phosphorylated HDAC3 (p‐HDAC3) protein expression was performed on cell lysates. Representative blots are shown. Densitometry is presented as the mean (±SEM) of n=3 experiments. HDAC indicates histone deacetylases; LVHF, left ventricular heart failure; TAC, transverse aortic constriction; TSP1, thrombospondin 1.
Figure 4.
Figure 4.
Activated CD47 promotes decreased cytosolic and increased nuclear HDAC3 expression. Western immunoblots of nuclear (A) and cytosolic (B) HDAC3 expression in LV tissue samples from wild‐type (WT) and CD47 (−/−) null animals 4 weeks post‐TAC or control. Densitometry is presented as the mean (±SEM) of n=6 to 9 animals per group. *=statistically significant difference (P<0.05), compared to WT; #=statistically significant difference (P<0.05), compared to WT TAC. Rat neonatal cardiac myocytes (RNCMs) were treated with peptide 7N3 (10 μmol/L) for 3 hours, and Western immunoblot analysis of cytosolic and nuclear total HDAC3 (t‐HDAC3) (C) and cytosolic and nuclear phosphorylated HDAC3 (p‐HDAC3) (D) protein expression was performed. Densitometry is presented as the mean (±SEM) of n=6 to 9 separate experiments. *=statistically significant difference (P<0.05), compared to control. E, Immunofluorescence staining of RNCMs treated with peptide 7N3 (10 μmol/L) for 3 and 24 hours, respectively. DAPI, total HDAC3, and p‐HDAC3, and actin are colored blue, red, and green, respectively. Stained area of fluorescence is presented as the mean (±SEM) of analysis of multiple (>3) regions of interest (ROIs) per culture dish with n=a minimum of 4 cells per ROI. Fluorescent images were captured with an Olympus Fluoview 1000 confocal microscope (software version 2.01; Olympus America Inc., Bethlehem, PA) and analyzed with NIS Elements (version 4.13; Nikon Instruments, Inc., Melville, NY) and calculated as total red (p‐ or t‐HDAC3) area in nuclei/total red (p‐ or t‐HDAC3) area in cytosol. *=statistically significant difference (P<0.05), compared to control. F, Western immunoblots of nuclear and cytosolic HDAC3 expression in LV tissue samples from WT mice±a CD47 antagonist antibody (Ab) (clone 301, 0.4 μg/g body weight IP weekly for 3 weeks). Animals underwent TAC for 1 week before beginning Ab treatment. Densitometry is presented as the mean (±SEM) of n=6 to 9 animals per group. *=statistically significant difference (P<0.05), compared to WT; #=statistically significant difference (P<0.05), compared to WT TAC. HDAC indicates histone deacetylases; LV, left ventricle; TAC, transverse aortic constriction.
Figure 5.
Figure 5.
Gene suppression of HDAC3 mitigates LVHF. A, H&E staining of murine left ventricle tissue sections 4 weeks post‐TAC or post‐TAC followed 1 week later with HDAC3 morpholino treatment. Cell‐size quantification is presented as the mean (±SEM) of analysis of 4 to 5 slides per animal sample, 10 random hpf per slide, 3 to 4 animals per treatment group. *=statistically significant difference (P<0.05), compared to wild‐type (WT); #=statistically significant difference (P<0.05), compared to WT TAC. Representative images are presented (original magnification, ×40). B, Immunofluorescence staining of murine left ventricle tissue sections 4 weeks post‐TAC or post‐TAC followed 1 week later with HDAC3 morpholino treatment. DAPI, collagen I, and phalloidin are colored blue, green, and red, respectively. Fibrosis is calculated as intensity of fluorescence and is presented as the mean (±SEM) of analysis of 4 to 5 slides per animal sample, 10 random hpf per slide, 4 to 8 animals per treatment group. *=statistically significant difference (P<0.05), compared to WT; #=statistically significant difference (P<0.05), compared to WT TAC. Representative images are presented (original magnification, ×40). C, Assessment by open‐chest pressure volume loop analysis of cardiac output, contractility, and ventricular stiffness (dp/dt min) of animals from the indicated groups. Data are presented as the mean (±SEM) of n=4 to 12 animals/group. *=statistically significant difference (P<0.05), compared to WT and WT TAC, respectively; #=statistically significant difference (P<0.05), compared to WT TAC. D, Left ventricle weights alone and normalized to body weight from animals in treatment groups as in A. Data are presented as the mean (±SEM) of n=4 to 12 animals/group. *=statistically significant difference (P<0.05), compared to WT; #=statistically significant difference (P<0.05), compared to WT TAC. E, Representative pressure volume tracings are shown from WT, WT TAC, and WT TAC+HDAC3 morpholino‐treated mice. Western immunoblot analysis of HDAC3 (F), TSP1 (G), and CD47 (H) protein expression in LV samples from animals in the indicated groups. Densitometry is presented as the mean (±SEM) of n=4 to 9 animals/group. *=statistically significant difference (P<0.05), compared to control; #=statistically significant difference (P<0.05), compared to WT TAC. I, Rat neonatal cardiac myocytes were treated with a CD47 antibody (Ab; clone OX101, 1 mg/mL)±peptide 7N3 (10 μmol/L) for 48 hours, and expression of total HDAC3 and phosphorylated HDAC3 (p‐HDAC3) by Western immunoblot was determined. Densitometry is presented as the mean (±SEM) of 3 separate experiments. *=statistically significant difference (P<0.05), compared to 7N3+CD47 Ab treated. J, TUNEL staining of murine LV tissue sections from WT and 4 weeks post‐TAC animals with and without HDAC3 morpholino treatment. Data are presented as the mean (±SEM) of the ratio of TUNEL‐positive cells over total nuclei from analysis of 4 to 5 slides per animal sample, 10 random hpf per slide, 3 to 4 animals per treatment group. *=statistically significant difference (P<0.05), compared to WT TAC. DAPI indicates 4',6‐diamidino‐2‐phenylindole; HDAC, histone deacetylase; H&E, hematoxylin and eosin; LVHF, left ventricular heart failure; TAC, transverse aortic constriction; TSP1, thrombospondin‐1; TUNEL, terminal deoxynucleotidyl transferase dUTP nick end labeling.
Figure 6.
Figure 6.
Activated CD47 increases CaMKII expression to increase HDAC3. A, Western immunoblot analysis of CaMKII and phosphorylated CaMKII (p‐CaMKII) protein expression in LV tissue samples from patients with nonischemic end‐stage LVHF (n=4) and normal controls (n=5). Densitometry is presented as the mean (±SEM). *=statistically significant difference (P<0.05), compared to control. B, Western immunoblot analysis of CaMKII and p‐CaMKII protein expression in left ventricular tissue samples from wild‐type (WT) and CD47‐null animals 4 weeks post‐TAC or controls. Densitometry is presented as the mean (±SEM) of n=6 to 9 animals/group. *=statistically significant difference (P<0.05), compared to control. C, Rat neonatal cardiac myocytes (RNCMs) were treated with peptide 7N3 (10 μmol/L) for the indicated time points, and Western immunoblot analysis of p‐CaMKII and total CaMKII protein expression was performed. Densitometry is presented as the mean (±SEM) of 3 separate experiments. *=statistically significant difference (P<0.05), compared to control. RNCMs were treated with either a CD47 antibody (D; OX101, 1 mg/mL for 48 hours) or the specific CaKMII inhibitor, AIP (E; 10 nmol/L, 30 minutes)±peptide 7N3 (10 μmol/L, 3 hours), and Western immunoblot analysis of p‐CaMKII, HDAC3, and phosphorylated HDCA3 (p‐HDAC3) was performed. Densitometry is presented as the mean (±SEM) of 3 separate experiments. *=statistically significant difference (P<0.05), compared to 7N3+CD47 Ab treated and 7N3+AIP. F, RNCMs were loaded with the calcium indicator, Fluo‐4 AM, treated with peptide 7N3 (10 μmol/L)±tetracaine (0.5 mmol/L) for the indicated time points, and images were acquired. Fluorescent intensity was determined and results are expressed as the mean±(SEM) from the analysis of cells within a minimum of 7 to 11 regions of interest per culture dish per treatment group. Significant difference (P<0.05) between treatment groups 7N3, compared to 7N3+tetracaine, from 17 through 30 minutes. G, Western immunoblot analysis of total and phosphorylated PLB (p‐PLB) protein expression in left ventricular tissue samples from WT and CD47‐null animals 4 weeks post‐TAC or controls. Densitometry is presented as the mean (±SEM) of n=4 to 6 animals/group. *=statistically significant difference (P<0.05), compared to control; #=statistically significant difference (P<0.05), compared to WT TAC. AIP indicates autocamtide‐2‐related inhibitory peptide; CaMKII, calcium/calmodulin‐dependent protein kinase II; LVHF, left ventricular heart failure; TAC, transverse aortic constriction.
Figure 7.
Figure 7.
Activated CD47 promotes accumulation of autophagy markers in LVHF. A, Western immunoblot analysis of LC3 protein expression in LV tissue samples from patients with nonischemic end‐stage LVHF (n=4) and controls (n=5). Densitometry is presented as the mean of all samples (±SEM). *=statistically significant difference (P<0.05), compared to controls. B, Western immunoblot analysis of LV LC3 protein expression in age‐matched male wild‐type (WT) C57BL/6 mice pre‐TAC and at the indicated days post‐TAC (n=3 to 4 animals in each treatment group). Densitometry is presented as the mean (±SEM). *=statistically significant difference (P<0.05), compared to pre‐TAC. C, Densitometry of Western immunoblot analysis of LC3 protein expression in LV tissue samples from age‐matched male WT and CD47 (−/−) null mice 4 weeks post‐TAC or control. Densitometry is presented as the mean (±SEM) of n=6 to 9 animals/group. *=statistically significant difference (P<0.05), compared to WT. D, Densitometry of Western immunoblot analysis of LC3, ATG5, and ATG7 protein expression in LV tissue samples from WT mice post‐TAC±an HDAC3 morpholino (7 mg/kg body weight) or (E) a CD47 antagonist antibody (Ab; clone 301, 0.4 mg/kg body weight). Densitometry is presented as the mean (±SEM) of n=4 to 9 animals/group. *=statistically significant difference (P<0.05), compared to WT; *, #=statistically significant difference (P<0.05), compared to WT TAC. F, Rat neonatal cardiac myocytes (RNCMs) were treated with a CD47 antagonist (clone OX101, 1 mg/mL) or control Ab, (G) AIP (10 nmol/L, 30 minutes), or (H) an HDAC3 morpholino (10 mmol/L)±peptide 7N3 (10 mmol/L), cell lysates were prepared, and Western immunblots for LC3 performed. Densitometry is presented as the mean (±SEM) of 3 separate experiments. *=statistically significant difference (P<0.05), compared to 7N3+CD47 Ab, 7N3+AIP, and 7N3+HDAC3 morpholino, respectively. AIP indicates autocamtide‐2‐related inhibitory peptide; ATG, autophagy‐related gene; HDAC3, histone deacetylase 3; LC3, light‐chain 3; LVHF, left ventricular heart failure; TAC, transverse aortic constriction.
Figure 8.
Figure 8.
CD47 blockade results in decreased HADC3 expression and corrects established LV HF. (A) H&E staining of murine LV tissue sections from wild‐type (WT) mice 4 weeks post‐TAC or post‐TAC followed 1 week later with a CD47 antagonist antibody (Ab; clone 301, 0.4 μg/g body weight IP) weekly for 3 weeks. Quantification of cell size is presented as the mean (±SEM) of analysis of 4 to 5 slides per animal sample, 10 random hpf per slide, 3 to 4 animals per treatment group. *=statistically significant difference (P<0.05), compared to WT; #=statistically significant difference (P<0.05), compared to WT TAC. Representative images are presented (original magnification, ×40). B, Immunofluorescence staining of murine left ventricle tissue sections 4 weeks post‐TAC or control as above indicated in (A). DAPI, collagen I, and phalloidin are colored blue, green, and red, respectively. Fibrosis is calculated as intensity of fluorescence and is presented as the mean (±SEM) of analysis of 3 to 5 slides pre animal sample, 10 random hpf per slide, 4 to 8 animals per treatment group. *=statistically significant difference (P<0.05), compared to WT; #=statistically significant difference (P<0.05), compared to WT TAC. Representative images are presented (original magnification, ×40). C, Left ventricle weight alone and normalized to body weight from animals in treatment groups as indicated in (A). Data are presented as the mean (±SEM) of n=7 to 12 animals/group. *=statistically significant difference (P<0.05), compared to WT; #=statistically significant difference (P<0.05), compared to WT TAC. Assessment by open‐chest pressure volume loop analysis of cardiac output, contractility, and ventricular stiffness (dp/dt min) of animals from indicated treatment groups. Data are presented as the mean (±SEM) of n=7 to 12 animals/group. *=statistically significant difference (P<0.05), compared to WT and WT TAC, respectively; #=statistically significant difference (P<0.05). compared to WT TAC. D, Representative pressure volume tracings from WT, WT TAC, and WT TAC+CD47 Ab‐treated mice. Western immunoblot analysis of HDAC3 (E) and CaMKII (F) protein expression in LV samples from animals in the indicated groups. Densitometry is presented as the mean (±SEM) of n=4 to 5 animals/group. *=statistically significant difference (P<0.05), compared to WT; #=statistically significant difference (P<0.05), compared to WT TAC. G, Rat neonatal cardiac myocytes were treated with CD47 antagonist Ab (clone OX101, 1 mg/mL) or immunoglobulin G (IgG) control antibody±peptide 7N3 (10 μmol/L) for 48 hours, and cell size was determined. Representative images are presented (original magnification, ×40). Data are presented as the mean (±SEM) of 4 separate experiments. *=statistically significant difference (P<0.05), compared to IgG; #=statistically significant difference (P<0.05), compared to IgG+7N3. H, TUNEL staining of murine LV tissue sections from WT and 4 weeks post‐TAC animals with and without CD47 antagonist Ab treatment. Data are presented as the mean (±SEM) of the ratio of TUNEL‐positive cells over total nuclei from analysis of 4 to 5 slides per animal sample, 10 random hpf per slide, 3 to 4 animals per treatment group. *=statistically significant difference (P<0.05), compared to WT TAC. I, Schematic: Secreted TSP1 binds to cardiac myocyte CD47, stimulating extracellular movement of calcium through L‐type channels. This leads to ryanodine receptor (RyR2)‐mediated calcium efflux from the sarcoplasmic reticulum, activating CaMKII to up‐regulate HDAC3 and promote myocyte hypertrophy and LVHF. CaMKII indicates calcium/calmodulin‐dependent protein kinase II; DAPI indicates 4',6‐diamidino‐2‐phenylindole; HDAC3, histone deacetylases; H&E, hematoxylin and eosin; LVHF, left ventricular heart failure; TAC, transverse aortic constriction; TSP1, thrombospondin 1; TUNEL, terminal deoxynucleotidyl transferase dUTP nick end labeling.

Comment in

References

    1. Stehlik J, Edwards LB, Kucheryavaya AY, Benden C, Christie JD, Dobbels F, Kirk R, Rahmel AO, Hertz MI. The Registry of the International Society for Heart and Lung Transplantation: Twenty‐eighth Adult Heart Transplant Report. J Heart Lung Transplant. 2011; 30:1078-1109. - PubMed
    1. Bueno H, Ross JS, Wang Y, Chen J, Vidan MT, Normand SL, Curtis JP, Drye EE, Lichtman JH, Keenan PS, Kosiborod M, Krumholz HM. Trends in length of stay and short‐term outcomes among medicare patients hospitalized for heart failure. JAMA. 1993. ‐; 303:2141-2147. - PMC - PubMed
    1. Ross JS, Chen J, Lin Z, Bueno H, Curtis JP, Keenan PS, Normand SL, Schreiner G, Spertus JA, Vidan MT, Wang Y, Krumholz HM. Recent national trends in readmission rates after heart failure hospitalization. Circ Heart Fail. 2010; 3:97-103. - PMC - PubMed
    1. Bernheim SM, Grady JN, Lin Z, Wang Y, Savage SV, Bhat KR, Ross JS, Desai MM, Merrill AR, Han LF, Rapp MT, Drye EE, Normand SL, Krumholz HM. National patterns of risk‐standardized mortality and readmission for acute myocardial infarction and heart failure. Update on publicly reported outcomes measures based on the 2010 release. Circ Cardiovasc Qual Outcomes. 2010; 3:459-467. - PMC - PubMed
    1. Jugdutt BI. Aging and heart failure: changing demographics and implications for therapy in the elderly. Heart Fail Rev. 2010; 15:401-405. - PubMed

Publication types

Substances