

From mobile phone data to the spatial structure of cities
- PMID: 24923248
- PMCID: PMC4055889
- DOI: 10.1038/srep05276
From mobile phone data to the spatial structure of cities
Abstract
Pervasive infrastructures, such as cell phone networks, enable to capture large amounts of human behavioral data but also provide information about the structure of cities and their dynamical properties. In this article, we focus on these last aspects by studying phone data recorded during 55 days in 31 Spanish cities. We first define an urban dilatation index which measures how the average distance between individuals evolves during the day, allowing us to highlight different types of city structure. We then focus on hotspots, the most crowded places in the city. We propose a parameter free method to detect them and to test the robustness of our results. The number of these hotspots scales sublinearly with the population size, a result in agreement with previous theoretical arguments and measures on employment datasets. We study the lifetime of these hotspots and show in particular that the hierarchy of permanent ones, which constitute the 'heart' of the city, is very stable whatever the size of the city. The spatial structure of these hotspots is also of interest and allows us to distinguish different categories of cities, from monocentric and "segregated" where the spatial distribution is very dependent on land use, to polycentric where the spatial mixing between land uses is much more important. These results point towards the possibility of a new, quantitative classification of cities using high resolution spatio-temporal data.
Figures
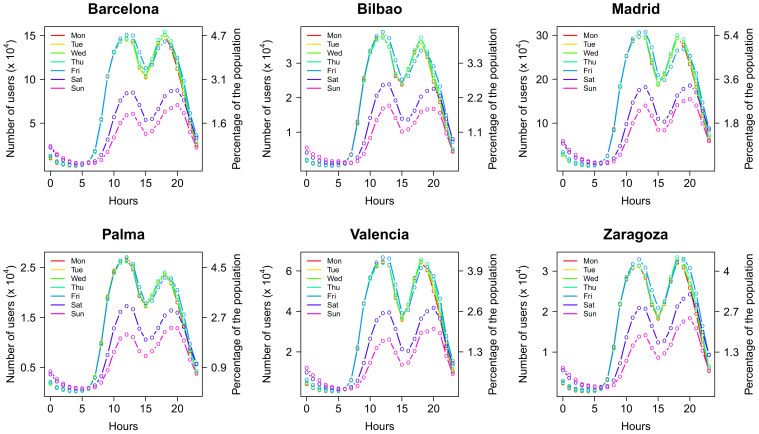
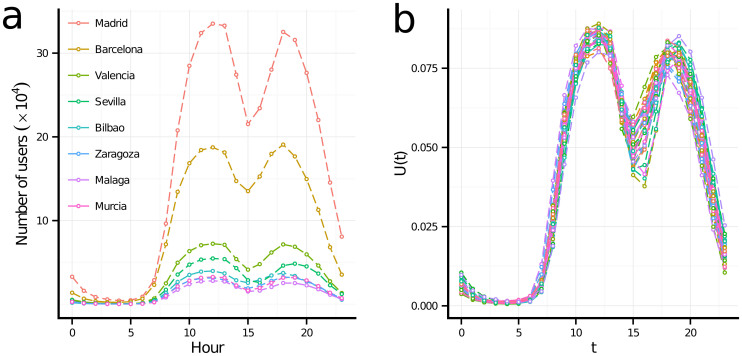
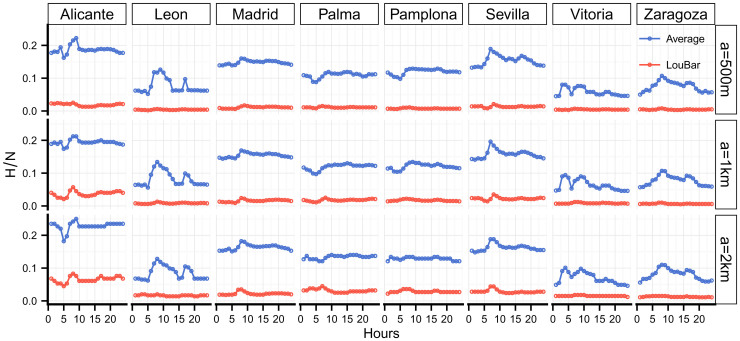
 . The good collapse suggests the existence of an urban rhythm common to all cities. This figure was created with R and LibreOffice Draw.
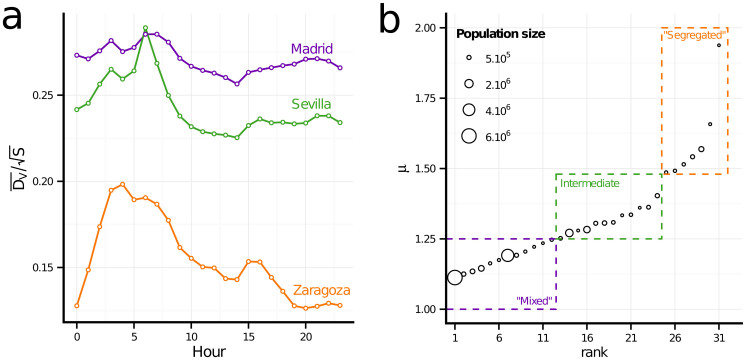
 the square root of the city's area) in order to compare the curves across cities. (b) Rank-size distribution of the dilatation index µ in the 31 metropolitan areas. This figure was created with R and LibreOffice Draw.
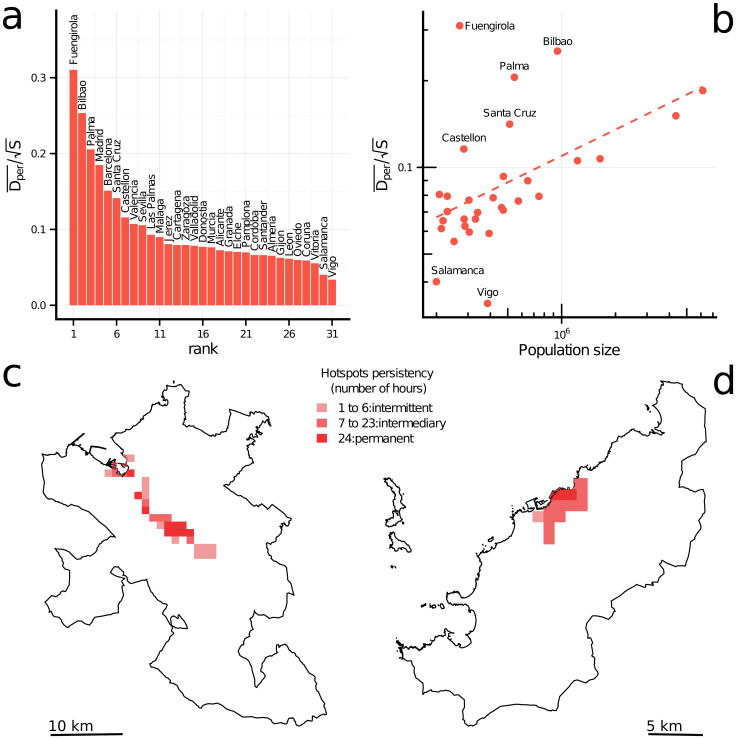
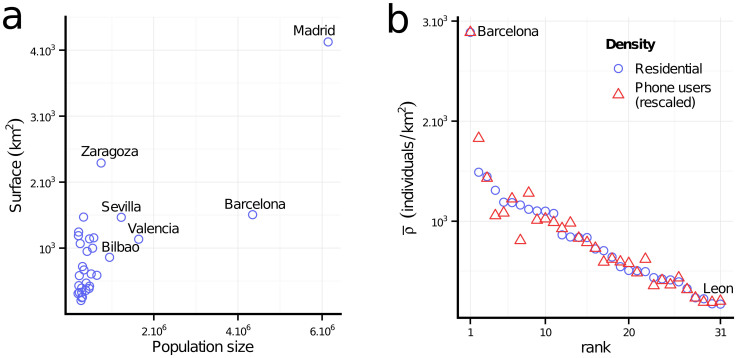
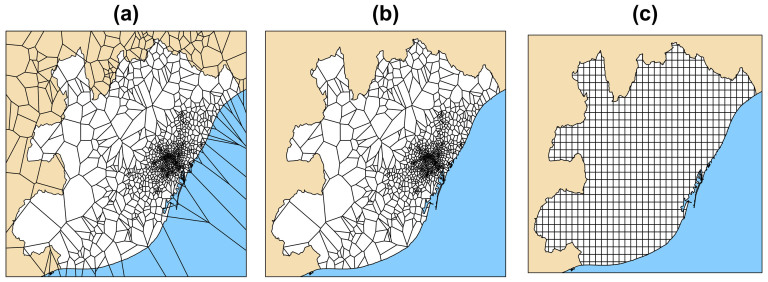
 among the 31 metropolitan areas. (b) Compacity versus population size. We observe a trend (at least for a large subset of cities, the corresponding fit is shown as a guide to the eye). (c) and (d) The spatial organization of the 1 km2 permanent hotspots determined by the Loubar method, in the urban areas of Bilbao (950, 000 inhabitants) and Vigo (385,000 inhabitants). These figures reveal two types of spatial organization: polycentric in the case of Bilbao (c), whose permanent hotspots are not contiguous and more spread over the space of the urban area, and clearly compact and monocentric in the case of Vigo (d) (The maps (c) and (d) were generated with R standard packages for handling spatial data and make use of freely available vector layers). This figure was created with R and LibreOffice Draw.
References
-
- Asgari F., Gauthier V. & Becker M. A survey on human mobility and its applications. arXiv:13070814 [physics] (2013).
-
- Gallotti R., Bazzani A. & Rambaldi S. Towards a statistical physics of human mobility. Int. J. Mod. Phy. C 23 (2012).
Publication types
Grants and funding
LinkOut - more resources
Full Text Sources
Other Literature Sources
