

Strategic planning to reduce the burden of stroke among veterans: using simulation modeling to inform decision making
- PMID: 24923722
- PMCID: PMC4287261
- DOI: 10.1161/STROKEAHA.114.004694
Strategic planning to reduce the burden of stroke among veterans: using simulation modeling to inform decision making
Abstract
Background and purpose: Reducing the burden of stroke is a priority for the Veterans Affairs Health System, reflected by the creation of the Veterans Affairs Stroke Quality Enhancement Research Initiative. To inform the initiative's strategic planning, we estimated the relative population-level impact and efficiency of distinct approaches to improving stroke care in the US Veteran population to inform policy and practice.
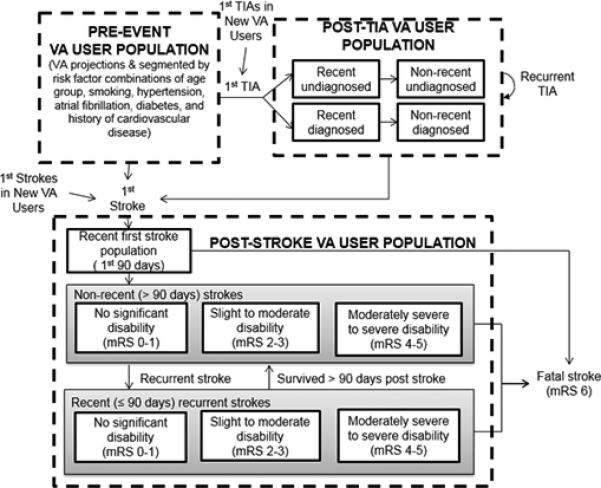
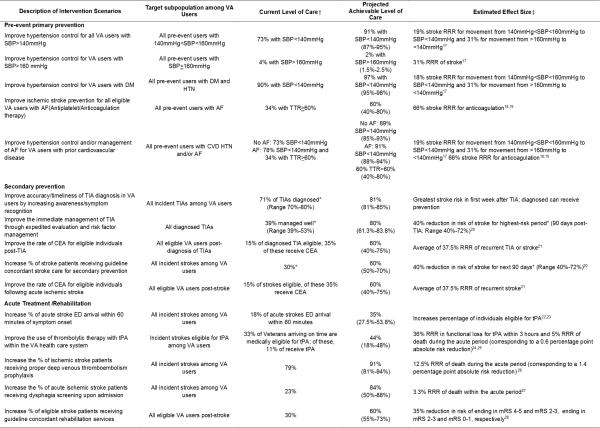
Methods: A System Dynamics stroke model of the Veteran population was constructed to evaluate the relative impact of 15 intervention scenarios including both broad and targeted primary and secondary prevention and acute care/rehabilitation on cumulative (20 years) outcomes including quality-adjusted life years (QALYs) gained, strokes prevented, stroke fatalities prevented, and the number-needed-to-treat per QALY gained.
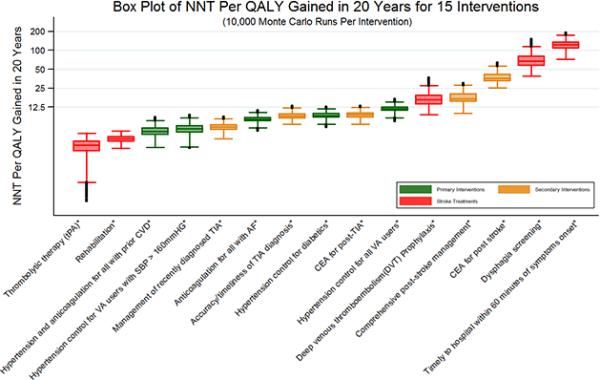
Results: At the population level, a broad hypertension control effort yielded the largest increase in QALYs (35,517), followed by targeted prevention addressing hypertension and anticoagulation among Veterans with prior cardiovascular disease (27,856) and hypertension control among diabetics (23,100). Adjusting QALYs gained by the number of Veterans needed to treat, thrombolytic therapy with tissue-type plasminogen activator was most efficient, needing 3.1 Veterans to be treated per QALY gained. This was followed by rehabilitation (3.9) and targeted prevention addressing hypertension and anticoagulation among those with prior cardiovascular disease (5.1). Probabilistic sensitivity analysis showed that the ranking of interventions was robust to uncertainty in input parameter values.
Conclusions: Prevention strategies tend to have larger population impacts, though interventions targeting specific high-risk groups tend to be more efficient in terms of number-needed-to-treat per QALY gained.
Keywords: Veterans; comparative effectiveness research; computer simulation; health planning; stroke.
© 2014 American Heart Association, Inc.
Figures
References
-
- Schwamm LH, Pancioli A, Acker JE, 3rd, Goldstein LB, Zorowitz RD, Shephard TJ, et al. Recommendations for the establishment of stroke systems of care: recommendations from the American Stroke Association's Task Force on the Development of Stroke Systems. Stroke. 2005;36:690–703. - PubMed
-
- [September 1, 2013];Stroke QUERI Fact Sheet. Stroke QUERI web site. http://www.queri.research.va.gov/about/factsheets/stroke_factsheet.pdf.
-
- Ventana Systems, Inc . Vensim DSS software: Version 5.11. Ventana Systems, Inc; Harvard, MA: 2012.
Publication types
MeSH terms
Grants and funding
LinkOut - more resources
Full Text Sources
Other Literature Sources
Medical
