. 2014 Aug;197(4):1377-93.
doi: 10.1534/genetics.114.166165. Epub 2014 Jun 11.

Identification of a QTL in Mus musculus for alcohol preference, withdrawal, and Ap3m2 expression using integrative functional genomics and precision genetics

Affiliations

Identification of a QTL in Mus musculus for alcohol preference, withdrawal, and Ap3m2 expression using integrative functional genomics and precision genetics

Jason A Bubier et al. Genetics. 2014 Aug.

Abstract

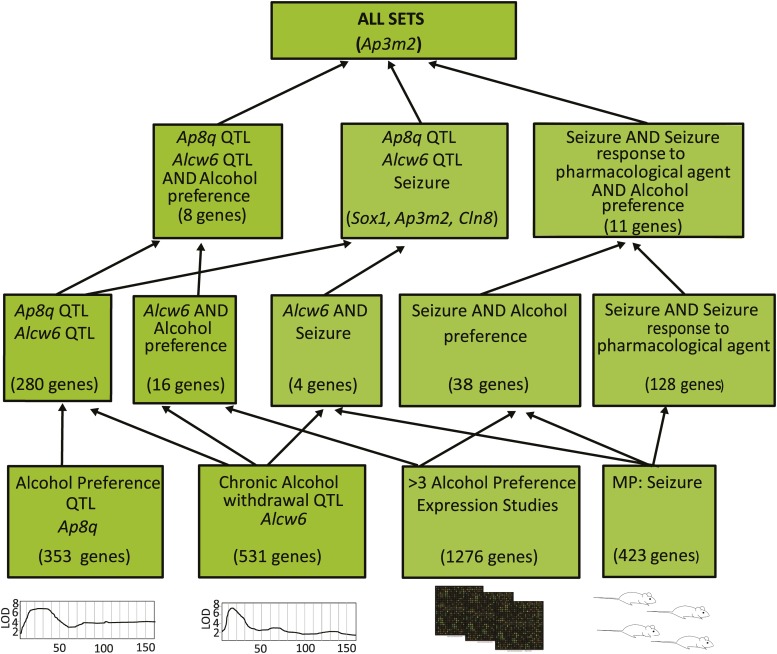
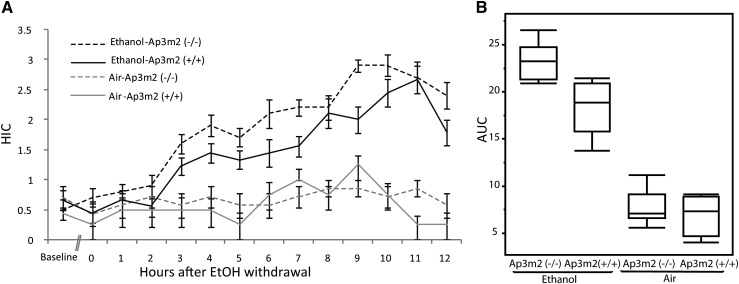
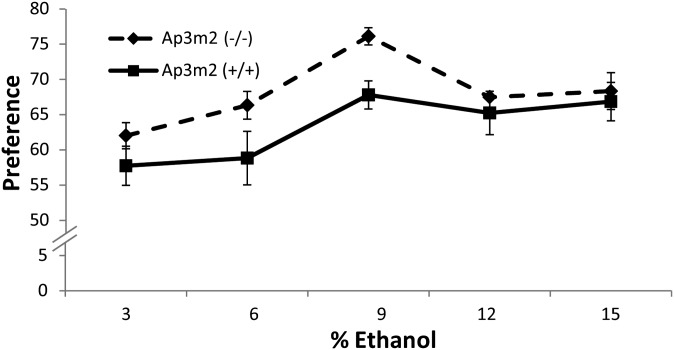
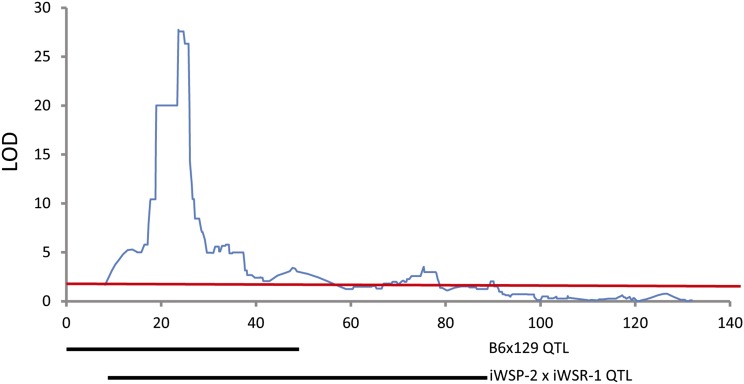
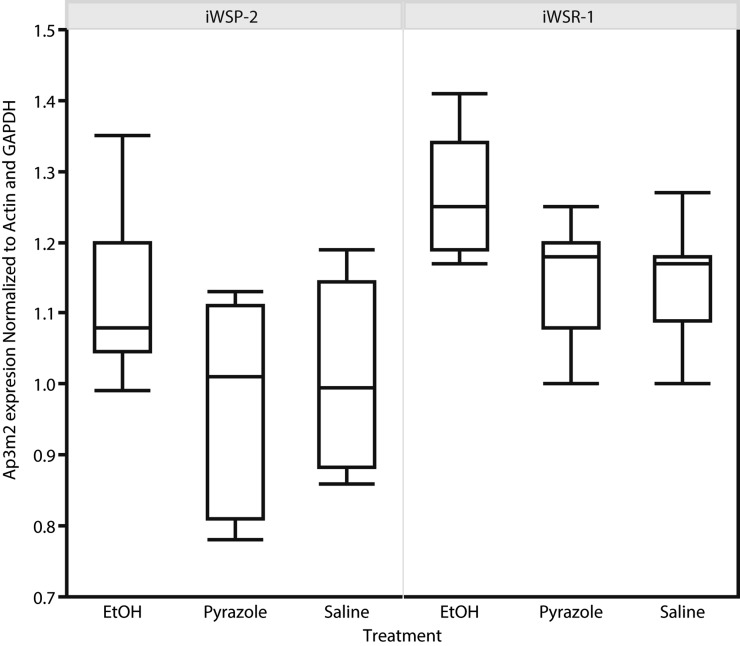
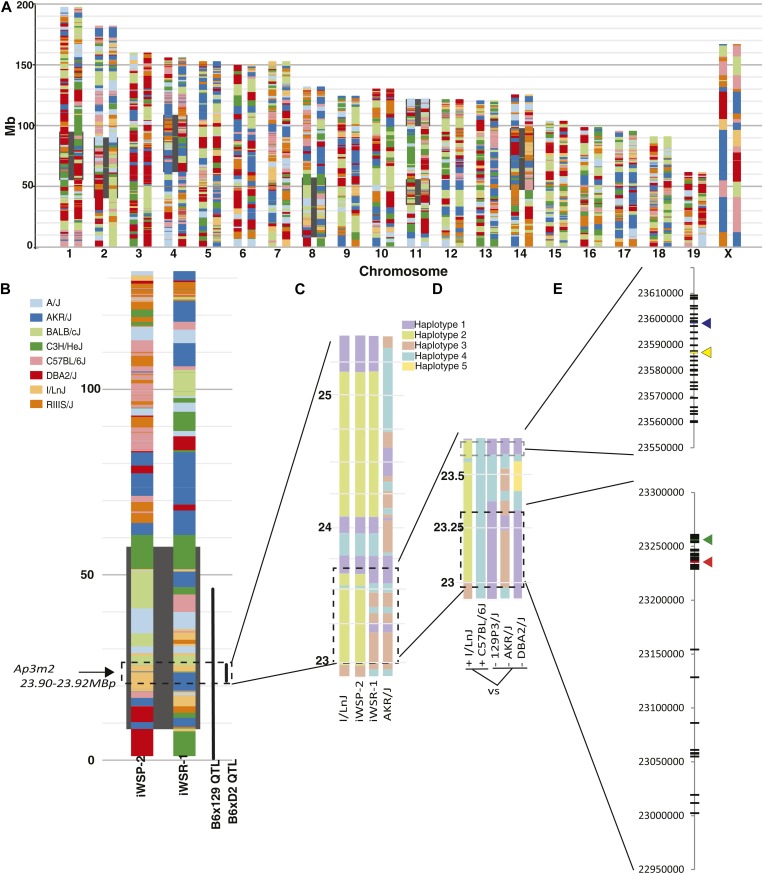
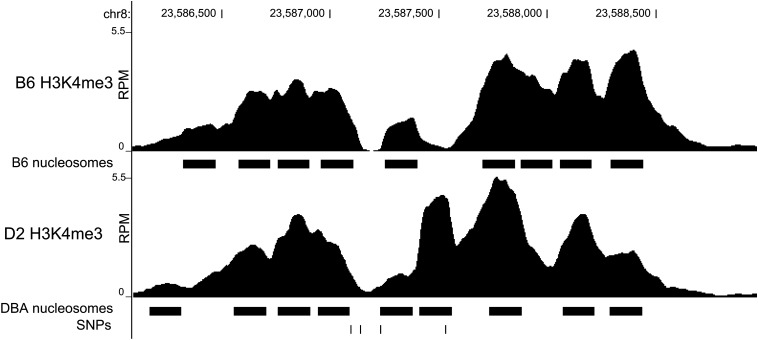
Extensive genetic and genomic studies of the relationship between alcohol drinking preference and withdrawal severity have been performed using animal models. Data from multiple such publications and public data resources have been incorporated in the GeneWeaver database with >60,000 gene sets including 285 alcohol withdrawal and preference-related gene sets. Among these are evidence for positional candidates regulating these behaviors in overlapping quantitative trait loci (QTL) mapped in distinct mouse populations. Combinatorial integration of functional genomics experimental results revealed a single QTL positional candidate gene in one of the loci common to both preference and withdrawal. Functional validation studies in Ap3m2 knockout mice confirmed these relationships. Genetic validation involves confirming the existence of segregating polymorphisms that could account for the phenotypic effect. By exploiting recent advances in mouse genotyping, sequence, epigenetics, and phylogeny resources, we confirmed that Ap3m2 resides in an appropriately segregating genomic region. We have demonstrated genetic and alcohol-induced regulation of Ap3m2 expression. Although sequence analysis revealed no polymorphisms in the Ap3m2-coding region that could account for all phenotypic differences, there are several upstream SNPs that could. We have identified one of these to be an H3K4me3 site that exhibits strain differences in methylation. Thus, by making cross-species functional genomics readily computable we identified a common QTL candidate for two related bio-behavioral processes via functional evidence and demonstrate sufficiency of the genetic locus as a source of variation underlying two traits.

Keywords: behavioral genetics; complex traits; data integration.


Figures

Figure 1
Figure 1
A hierarchical similarity chart of alcohol preference- and withdrawal-related gene sets. At the bottom of the chart are individual gene sets derived from aggregate alcohol preference and withdrawal QTL, differential expression, and mutation characterization. Each successive level from the bottom to the top of the chart represents increasingly higher order intersections among these gene sets, with the most highly connected genes at the top.
Figure 2
Figure 2
Increased chronic alcohol-withdrawal effects in Ap3m2 (−/−) knockout mice. B6.129P2-Ap3m2tm1Ohno/EJC [Ap3m2 (−/−)] were exposed to ethanol vapor for 72 hr and then assayed for HIC. (A) HIC curves over time after cessation of ethanol vapor exposure for Ap3m2 (−/−) mice and their wild-type littermates. (B) The area under the curve for withdrawal seizures over time was significantly greater in Ap3m2 (−/−) than in littermate controls with a genotype × treatment (F(3, 24) = 94.05, P = 0.0325).
Figure 3
Figure 3
Increased alcohol preference in Ap3m2 (−/−) knockout mice. Alcohol preference in B6.129P2-Ap3m2tm1Ohno/EJC [Ap3m2 (−/−)] was evaluated using the two-bottle water vs. ethanol choice test with increasing concentrations of ethanol every 4 days for 20 days. The Ap3m2 (−/−) mice had significantly higher preference for ethanol than the wild-type littermates across concentrations (between groups F(1,36) = 4.8646, P = 0.0339).
Figure 4
Figure 4
A cis-eQTL for Ap3m2 expression in the hippocampus of the BXD RI population. The peak eQTL for Ap3m2 maps to chromosome 8 between 22.906 and 25.498 Mb (LOD = 27.74, P < 0.05). Chromosome 8 QTL map is plotted with megabase position (UCSC mm9, NCBI MGSCv37) on the horizontal and with LRS on the vertical [P < 0.05, LOD = 3.79 (red line)].
Figure 5
Figure 5
Genotype and alcohol effects on Ap3m2 expression in iWSP-2 and iWSR-1 mice. ΔΔCt qPCR of iWSP-2 and iWSR-1 mice exposed to 72 hr of chronic ethanol vapor treatment plus pyrazole injection to stabilize blood ethanol concentrations vs. saline-injected and pyrazole-injected air-treated controls. Both genotype and treatment had a significant effect on Ap3m2 expression level: full model F(5,59) = 7.9606, P = 0.0002; Fgenotype (1,56) = 32.9909, P = 0.0001; and Ftreatment(2,56) = 10.5352, P = 0.00001 with no significant genotype × treatment interaction. Post-hoc comparisons using Tukey–Kramer’s HSD revealed that there were no significant differences between the pyrazole or saline controls but that both groups had lower Ap3m2 transcript abundance than the ethanol-treated mice (P < 0.05).
Figure 6
Figure 6
Genetic dissection of shared allelic variants underlying overlapping QTL for alcohol preference and withdrawal. (A) A haplotype reconstruction of the iWSP-2 (left) and iWSR-1 (right) mouse strains based on dense genotyping of the inbred selected lines and existing genotypic data from nearest extant relatives. QTL for alcohol withdrawal seizure previously mapped in crosses of these strains are highlighted in black, including the Alcw6 locus on chromosome 8 (8.12–58.12 Mb) . The contributions of the eight HS progenitor strains are shown as determined by the Mouse Diversity Array using the SNP founder strain calls retrieved from CGDSNPdb (http://cgd.jax.org/cgdsnpdb/; Hutchins et al. 2010). (B) Enlarged reconstruction of chromosome 8 indicating location of QTL overlap of Alcw6, Ap8q (0–40.29 Mb), and BXD Ap3m2 expression QTL (22.906–25.498 Mb). The consensus QTL region on chromosome 8 is segregating I/LnJ and AKR/J haplotypes in the iWSP-2 and iWSR-1 strains. (C) Reconstruction of the iWSP-2 and iWSR-1 strain haplotypes in the region of chromosome 8 containing the consensus QTL (22.906–25.408 Mb-) from the best matching founder surrogate strains I/LnJ and AKR/J. Coloring distinguishes haplotype blocks detected in the Mouse Phylogeny Browser and does not represent genetic origin of each region. (D) Comparison of the overlapping region where iWSP-2 and iWSR-1 haplotypes differ (22.906–23.889 Mb) between reconstructed iWSP-2 and B6 (high alcohol preference, withdrawal, expression) to iWSR-1, 129, and DBA (lower alcohol preference, withdrawal, expression) haplotypes using Mouse Phylogeny Browser. Shared color blocks at a given location represent haplotype similarity across strains. (E) All genetically sufficient SNPs to account for the consensus QTL. SNPs within Ensembl regulatory features are shown with colored arrows. SNPs that contrast the strains used in the Ap8q mapping QTL (129 and B6), Alcw6 iWSP-2/iWSR-1-contributing QTL alleles (AKR/J, I/LnJ), and Ap3m2 BXD eQTL were extracted from Sanger Mouse Genomes (Keane et al. 2011; Yalcin et al. 2011; http://www.sanger.ac.uk/resources/mouse/genomes/) and are plotted in megabase coordinates on chromosome 8. iWSP-2 and iWSR-1 SNP data are publicly available at http://phenome.jax.org/ (accession no. MPD:432).
Figure 7
Figure 7
Nucleosome resolution H3K4me3 ChIP-seq. The abundance of sequence reads, expressed as RPM, from B6 and D2 covering the region of chromosome 8 containing the ensemble regulatory feature ENSMUSR00000299557. Predicted nucleosome positions are indicated as solid bars below the coverage profiles. The SNP track shows SNPs from left to right: rs32882991, rs52251207, rs259599964, and rs32926479. rs32926479 appears in a region differentially methylated between B6 and D2.

References

    1. Aerts S., Lambrechts D., Maity S., Van Loo P., Coessens B., et al. , 2006. Gene prioritization through genomic data fusion. Nat. Biotechnol. 24: 537–544. - PubMed
    1. Akil H., Martone M. E., Van Essen D. C., 2011. Challenges and opportunities in mining neuroscience data. Science 331: 708–712. - PMC - PubMed
    1. Bachmanov A. A., Tordoff M. G., Beauchamp G. K., 1996. Ethanol consumption and taste preferences in C57BL/6ByJ and 129/J mice. Alcohol. Clin. Exp. Res. 20: 201–206. - PMC - PubMed
    1. Bachmanov A. A., Reed D. R., Li X., Li S., Beauchamp G. K., et al. , 2002. Voluntary ethanol consumption by mice: genome-wide analysis of quantitative trait loci and their interactions in a C57BL/6ByJ × 129P3/J F2 intercross. Genome Res. 12: 1257–1268. - PMC - PubMed
    1. Baker C. L., Walker M., Kajita S., Petkov P. M., Paigen K., 2014. PRDM9 binding organizes hotspot nucleosomes and limits Holliday junction migration. Genome Res. 24: 724–732. - PMC - PubMed

Publication types

MeSH terms

Substances